The Global Auto Market Map, 2010, 2020 and 2025: Chinese Brands Doubled Their Share in Five Years
New-vehicle sales in eight markets by country and brand group.
How has the global car market changed in 15 years? We mapped new-vehicle sales in eight markets (China, the US, Europe, Japan, India, Korea, Brazil and five Southeast Asian countries) for 2010, 2020 and 2025. This article walks through the auto market infographics we published on Instagram.
The charts are in Korean. Key labels are translated in the text. In these Marimekko charts, the width of each column is a country’s share of sales across the eight markets, and the height of each block is a brand group’s share within that country.
1. The 2025 map
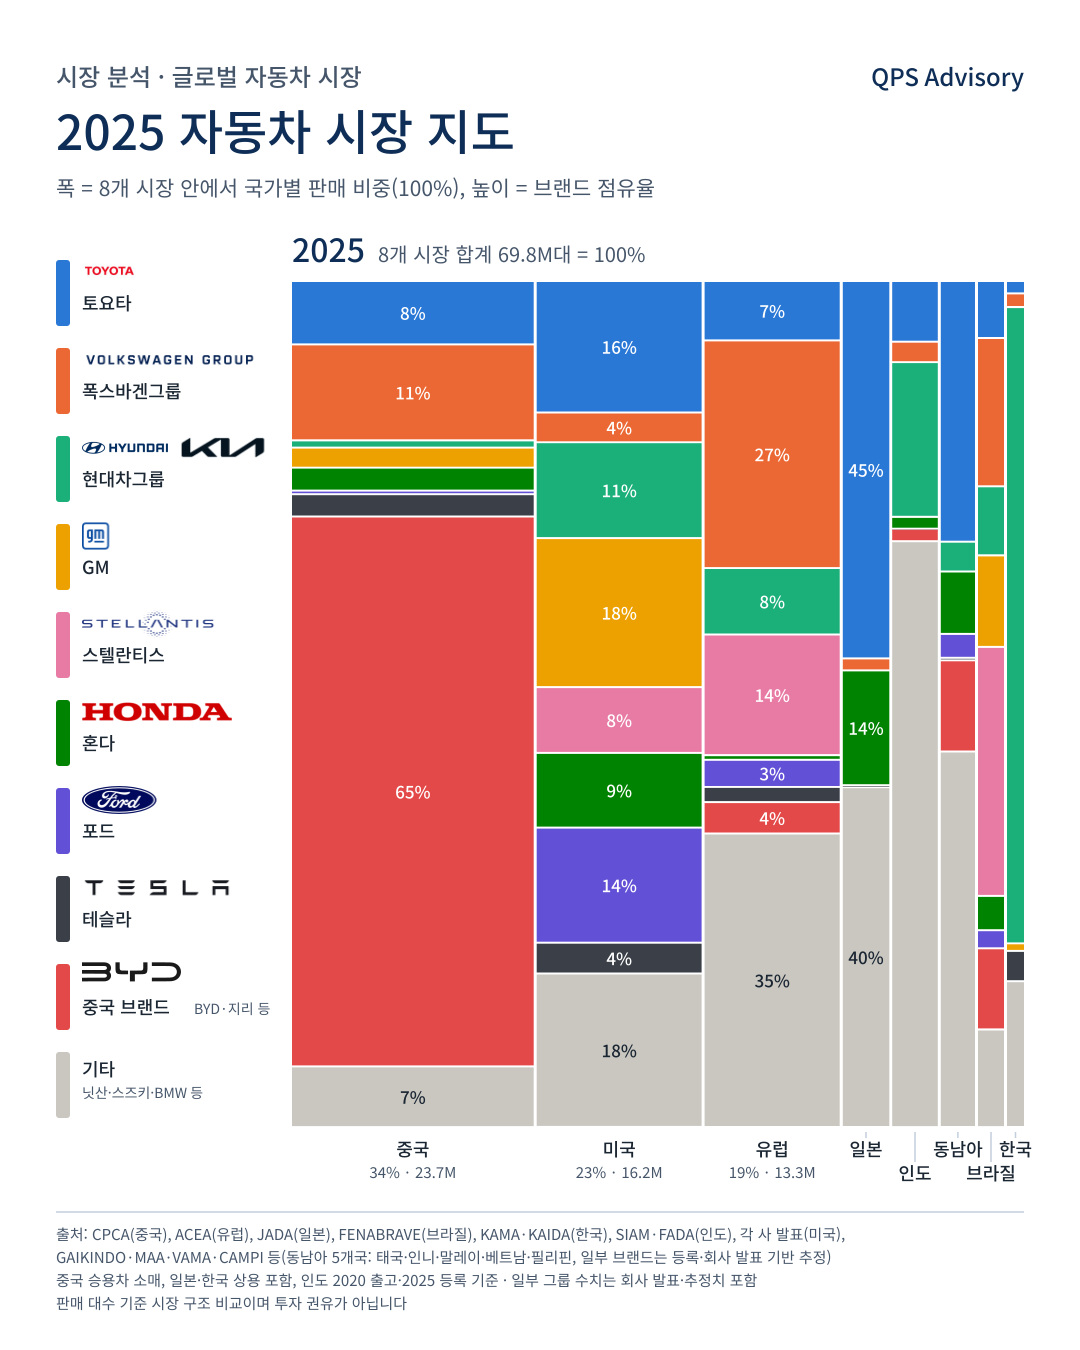
- Chinese brands doubled in five years: from 11.8% (2020) to 23.8% (2025) across the eight markets, and from 35.7% to 65.0% inside China.
- Now outside China: below 2% in every overseas market in 2020, Chinese brands reached 10.8% in Southeast Asia, 9.6% in Brazil and 3.7% in Europe in 2025.
2. Fifteen years of change
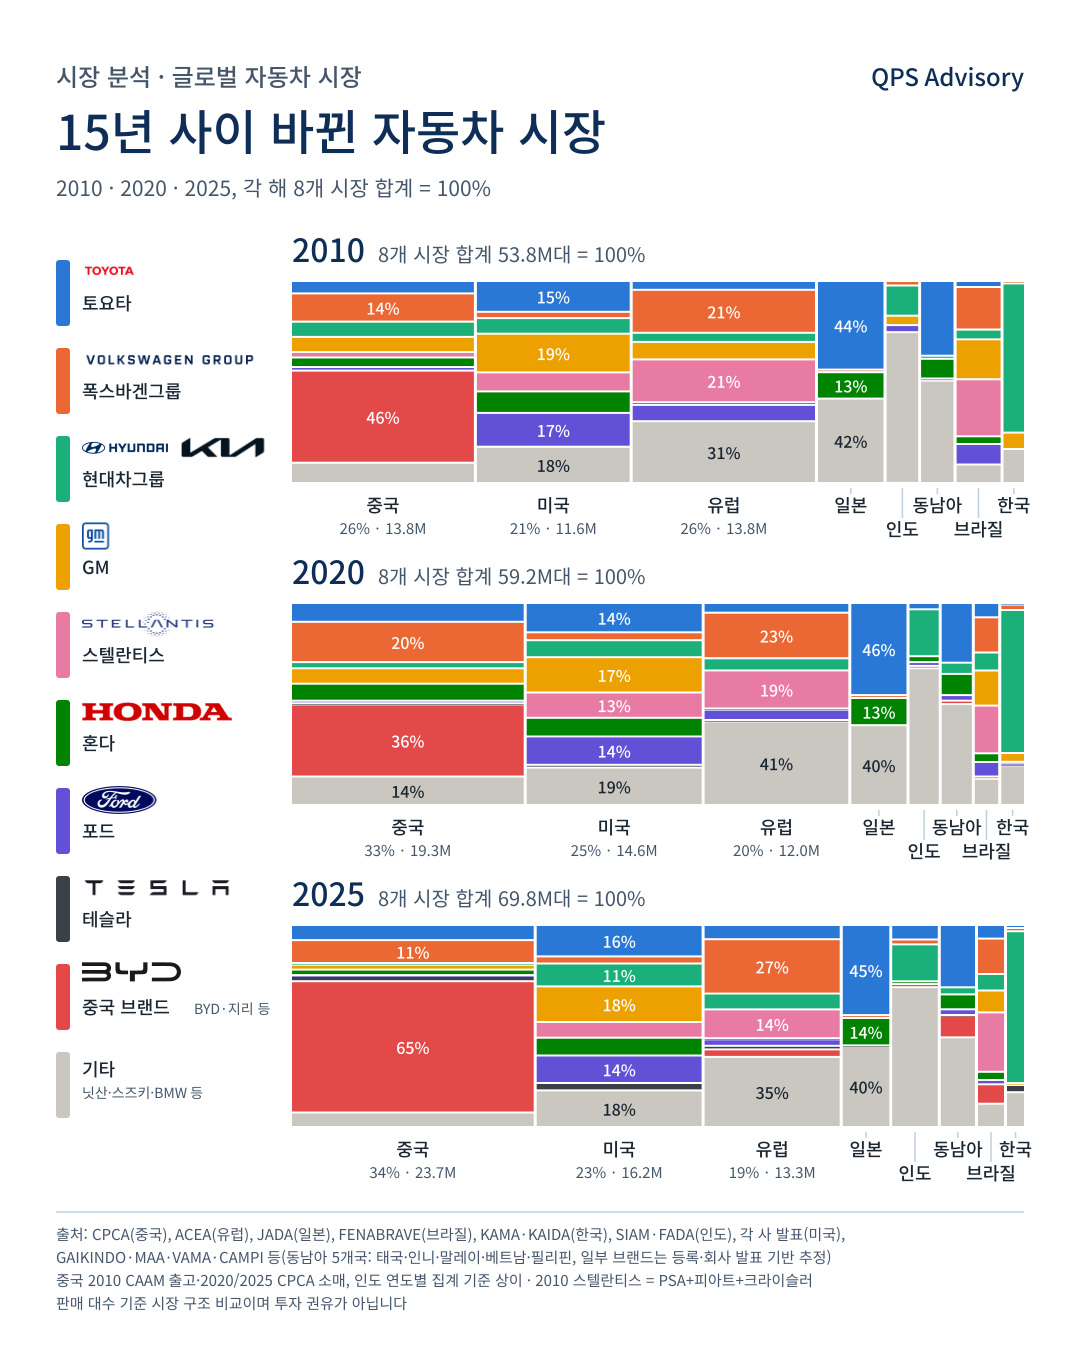
- US brands shrank: across the eight markets, GM fell from 9.9% to 5.3% and Ford from 7.0% to 4.1% (2010 to 2025).
- Toyota stayed on top: 11.9%, 12.8% and 12.6%, the largest group in all three years.
- Hyundai Motor Group changed regions: about 7.9% overall in each year, but the US rose from 7.7% to 11.3% and Europe from 4.5% to 7.9%, while China fell from 7.5% to 0.9%.
3. Most cars sold is not most valuable
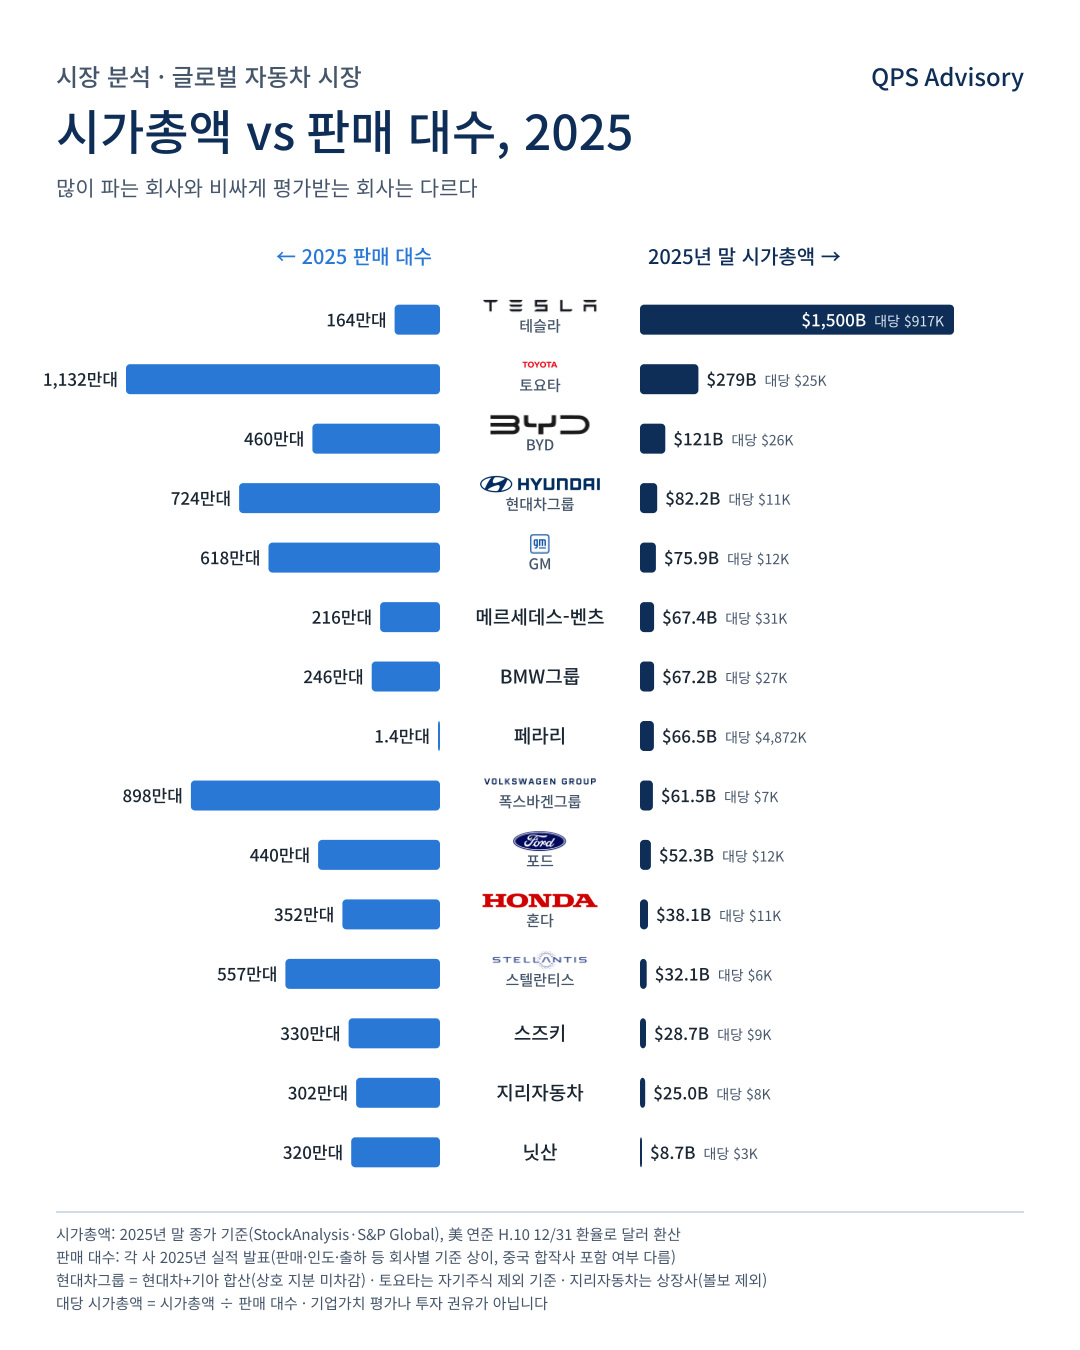
In 2025 Tesla sold 1.64 million vehicles and was worth USD 1.5tn, five times Toyota (USD 279bn), which sold 11.32 million. Market cap per vehicle sold was about USD 7,000 for Volkswagen and about USD 3,000 for Nissan.
Limitations
- Market definitions vary by year and country (China 2010 CAAM wholesale incl. minivans, 2020 and 2025 CPCA retail; India’s basis varies by year; Japan and Korea include commercial vehicles).
- Some group figures are company announcements or estimates; brands we could not find are in “Others”. Stellantis in 2010 combines PSA, Fiat and Chrysler.
- Market caps are as of end-2025, and unit definitions differ by company.
Sources are noted on each chart and in the text. This is market research, not investment advice, and its accuracy is not guaranteed.