Korea's Retail Channel Map, 2015–2025: Online at 59%, Coupang on Top, Hypermarkets in Retreat
Channel shares from the trade ministry and company shares from DART and WiseApp show a decade of change.
Over ten years, online doubled its share of Korean retail sales, and the top offline channel changed from hypermarkets to department stores and then to convenience stores. This article walks through the retail channel infographics we published on Instagram.
USD figures are converted at KRW 1,450 = USD 1.
1. Sales by channel, 2015–2025
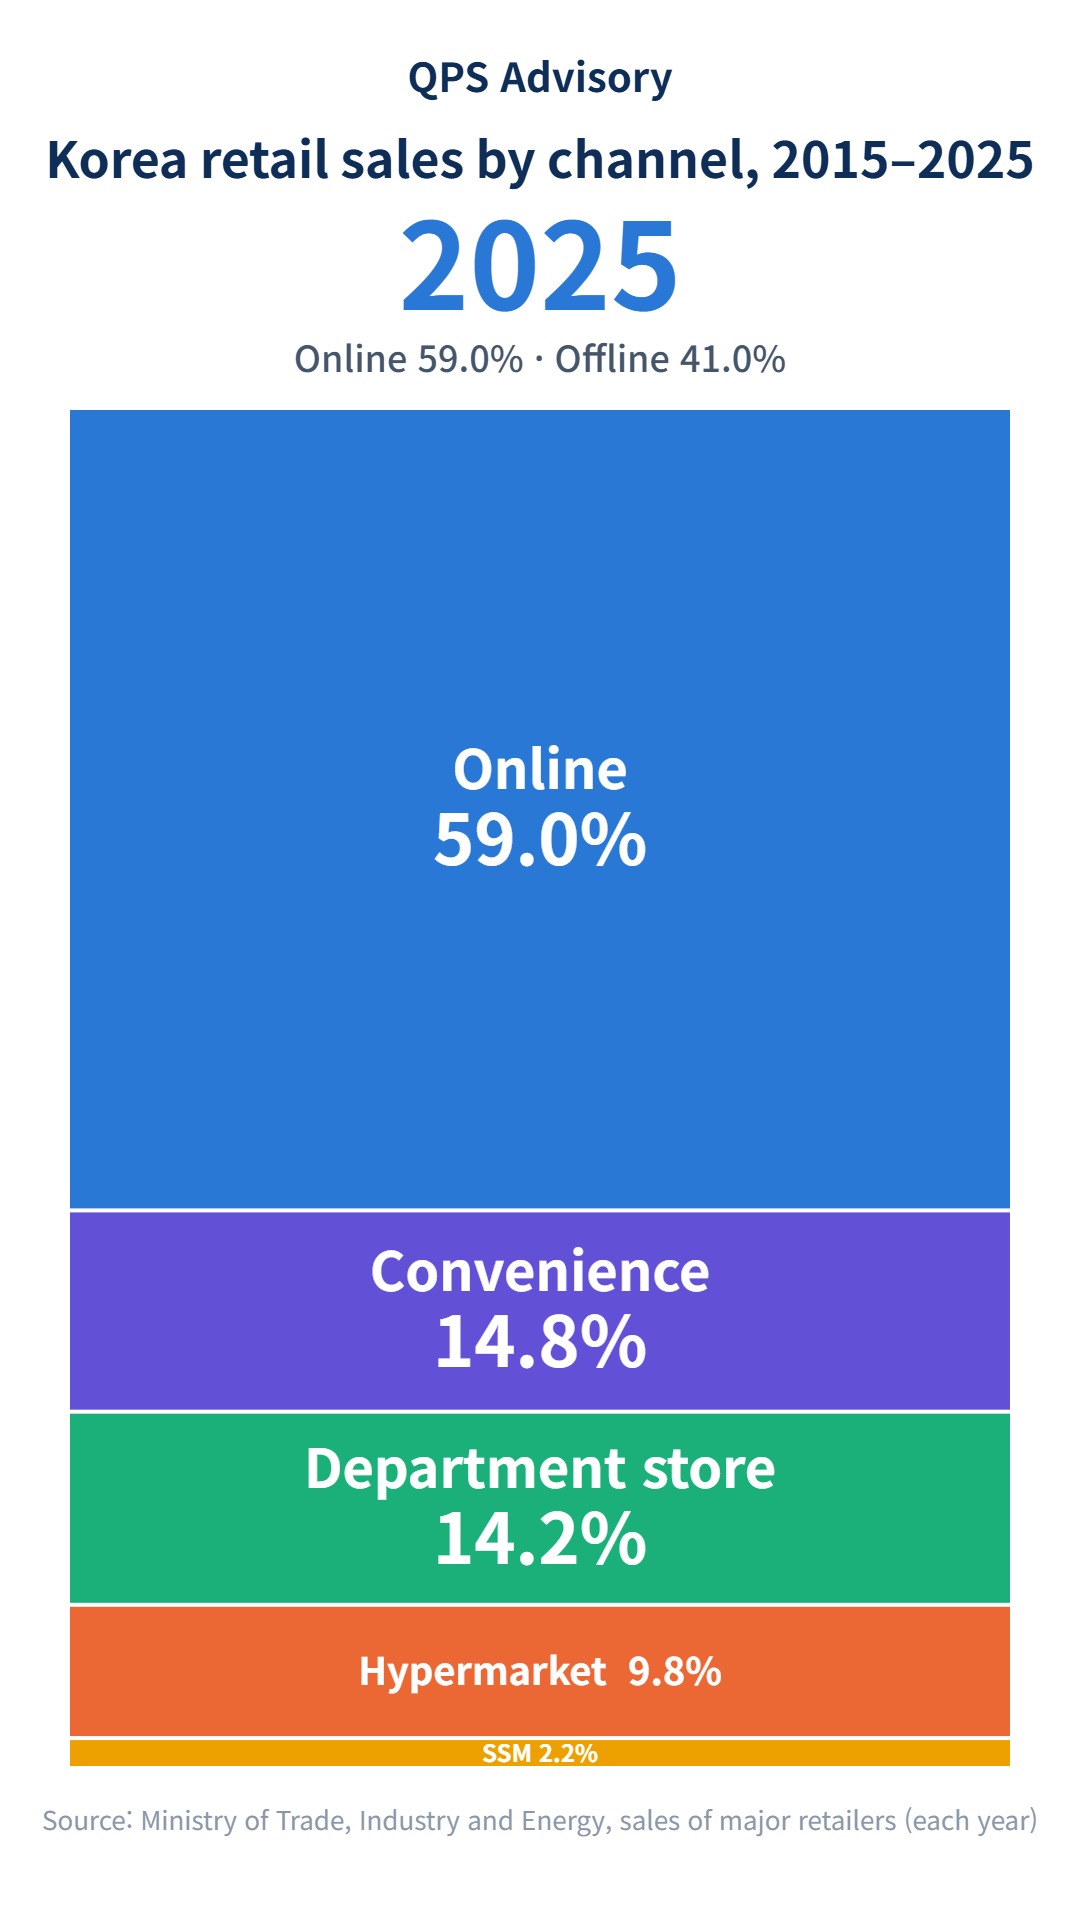
- Online is now more than half: 30.4% (2015) to 59.0% (2025), crossing 50% for the first time in 2023.
- A new offline leader: hypermarkets, then department stores (from 2021), then convenience stores (from 2025).
- Hypermarkets in retreat: 26.3% to 9.8%, from first to third offline.
- SSMs halved: 4.8% to 2.2%. SSMs (super supermarkets) are neighbourhood-sized supermarkets run by large groups, such as Lotte Super and GS The Fresh.
2. Companies inside each channel: a Marimekko chart
In these charts, the width of each column is the channel’s share of sales and the height of each block is a company’s share within that channel.
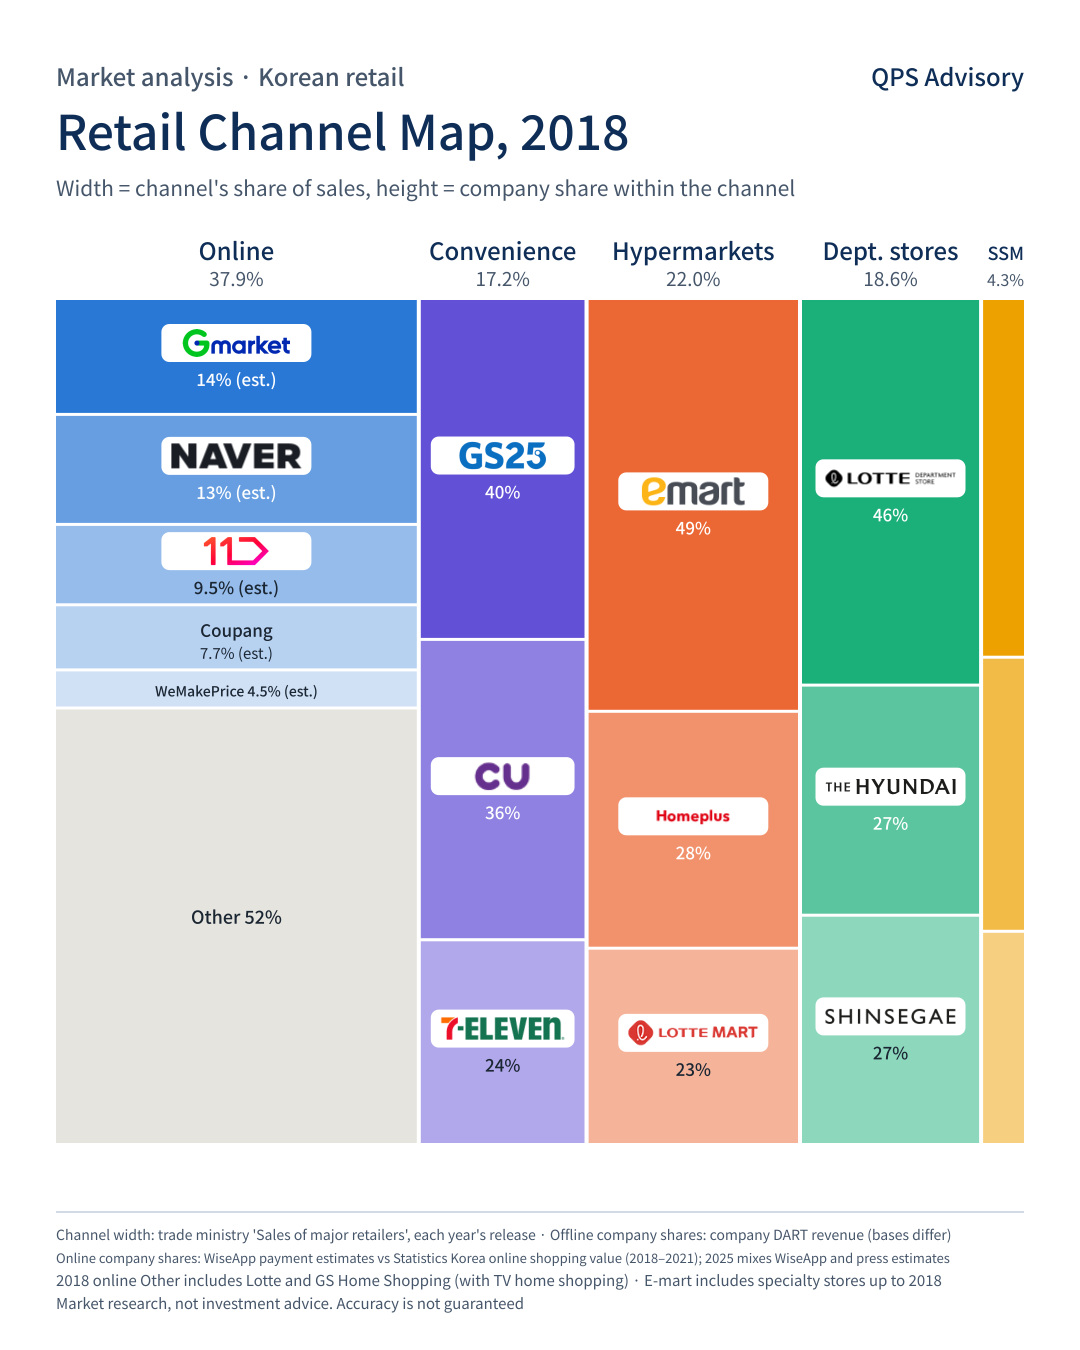
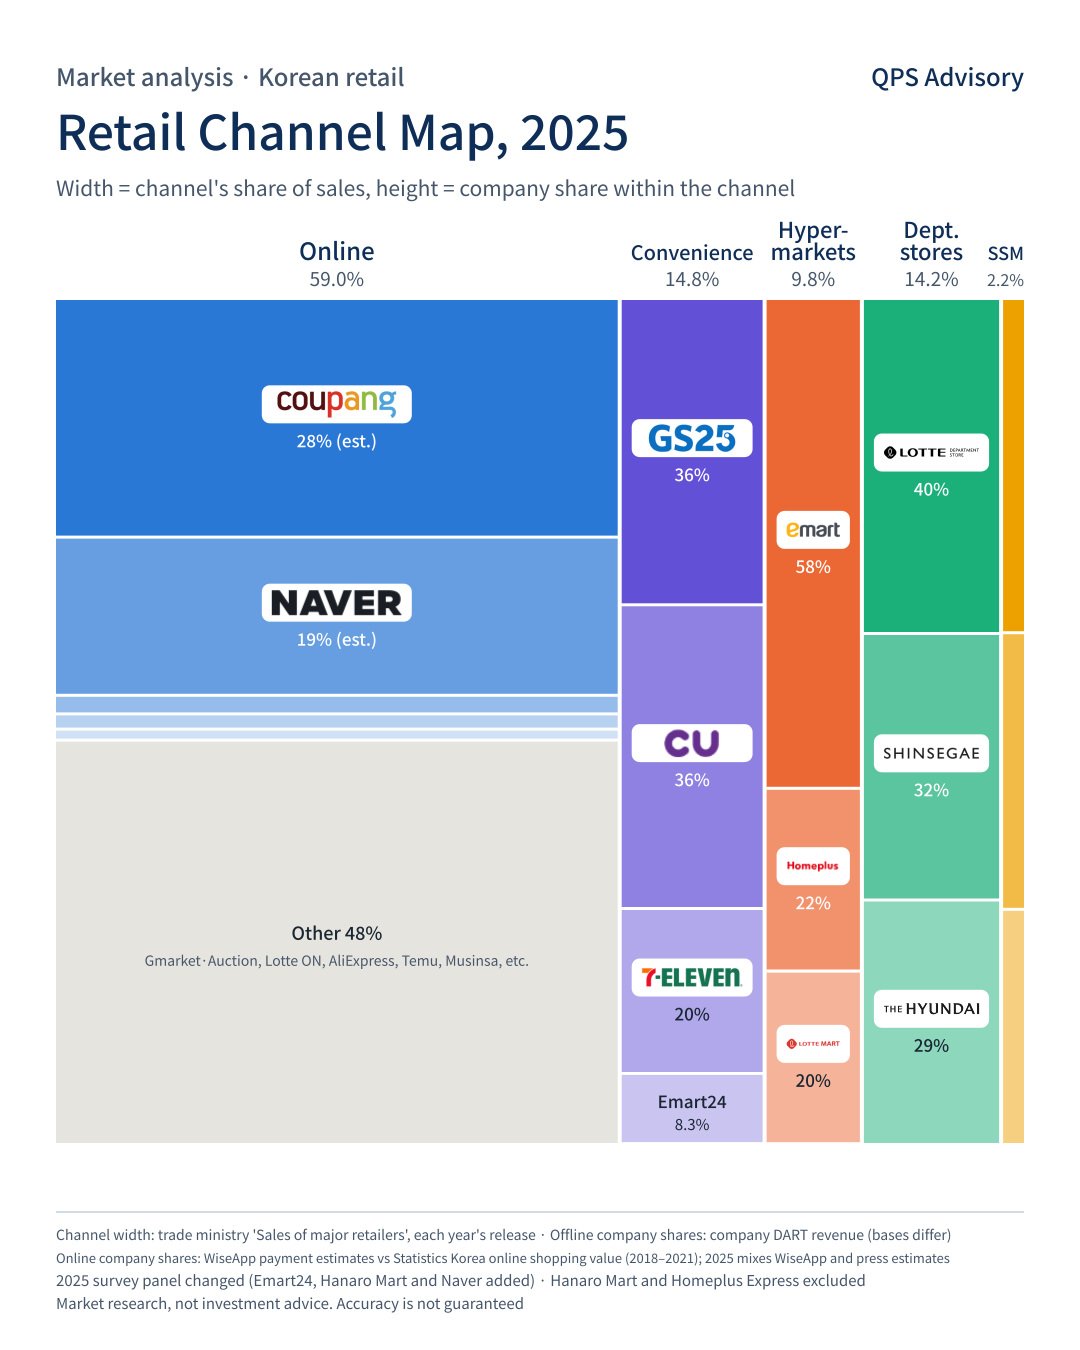
- Online: 37.9% (2018) to 59.0% (2025).
- Coupang, from fourth to first online: its share of online shopping transaction value rose from 7.7% (2018) to an estimated 28.2% (2025). Naver led in 2020 with 17.7%.
- Hypermarkets: 22.0% to 9.8%, while E-mart’s share inside the channel rose from 50% (2019) to 58%.
- Convenience stores lead offline: convenience stores 14.8%, department stores 14.2%, hypermarkets 9.8% (2025). Inside the channel, CU and GS25 hold 36% each.
- A new SSM leader: Lotte Super 42% to 28%, GS The Fresh 32% to 40%.
Online company shares use transaction value (what consumers paid) rather than reported revenue, so that marketplaces that book only commissions can be compared with retailers that buy and resell.
3. Daiso and Olive Young in the total retail market
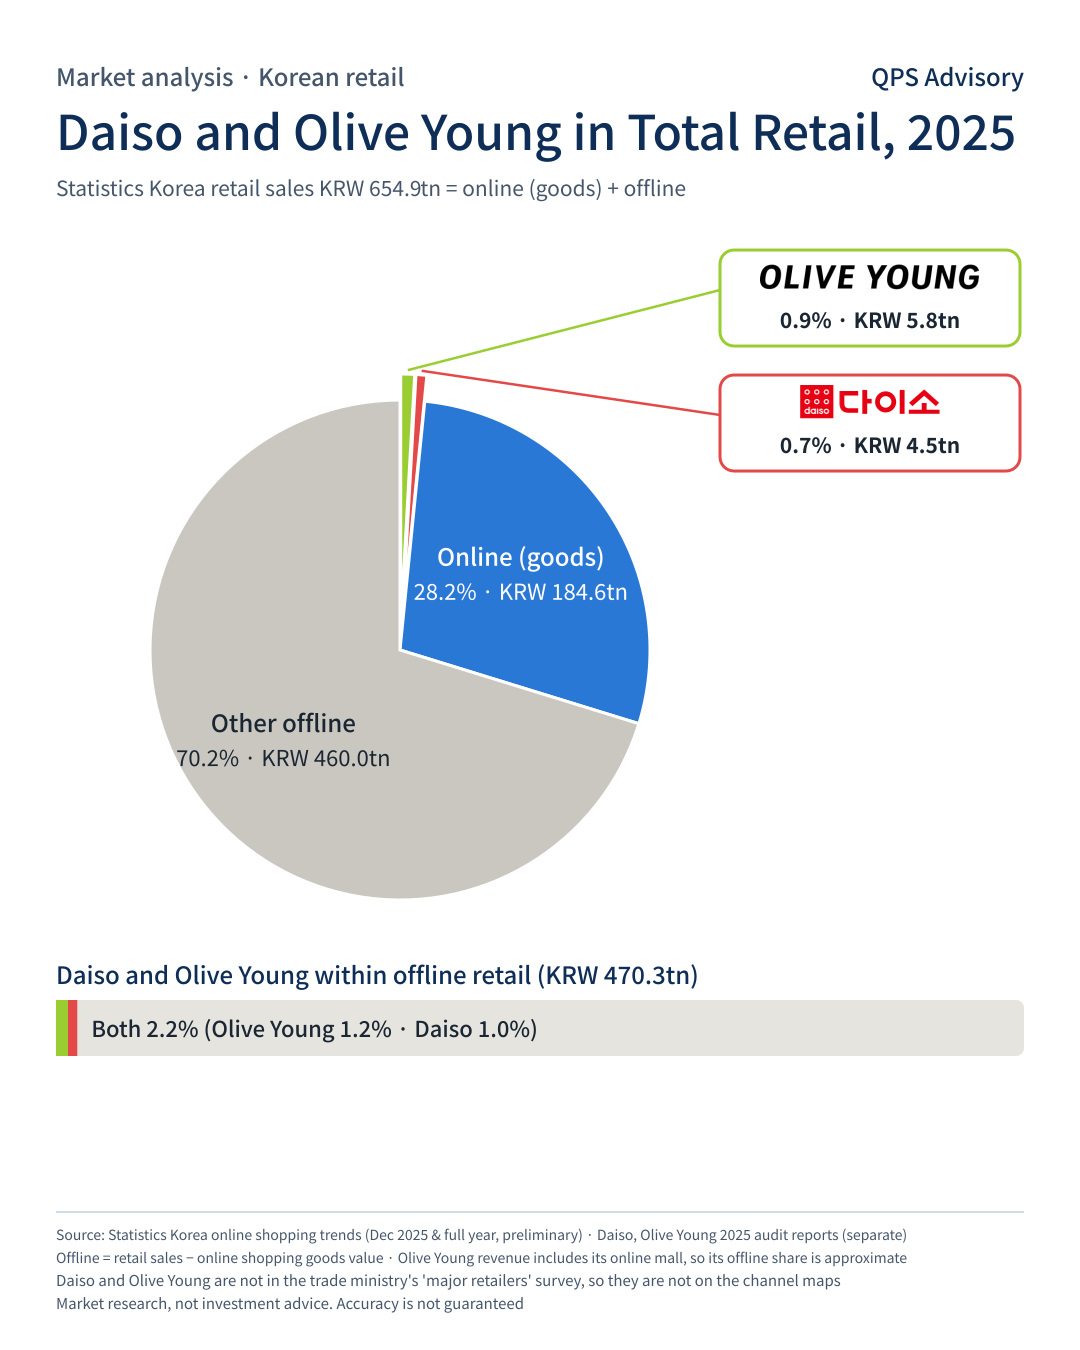
The ministry’s survey does not break out specialty retailers such as Daiso and Olive Young, so we used Statistics Korea’s total retail sales ($451.7bn in 2025) as the base. Online goods transaction value was $127.3bn, about 28.2%. Daiso and Olive Young’s combined revenue of $7.2bn is an estimated 1.6% of all retail sales and about 2.2% of offline.
Limitations
- The ministry survey covers sampled major retailers only, and its panel changed in 2025 (Emart24, Hanaro Mart and Naver added). The ministry’s online share (59.0%) and the Statistics Korea share (28.2%) are therefore different measures.
- Offline company shares are approximate because revenue bases differ (net, gross, franchisor revenue).
- Online company shares are WiseApp payment estimates for 2018–2021 and estimates from company IR and press reports for 2025.
- Sources: Ministry of Trade, Industry and Energy, company DART filings, Statistics Korea, WiseApp.
Sources are noted on each chart and in the text. This is market research, not investment advice, and its accuracy is not guaranteed.