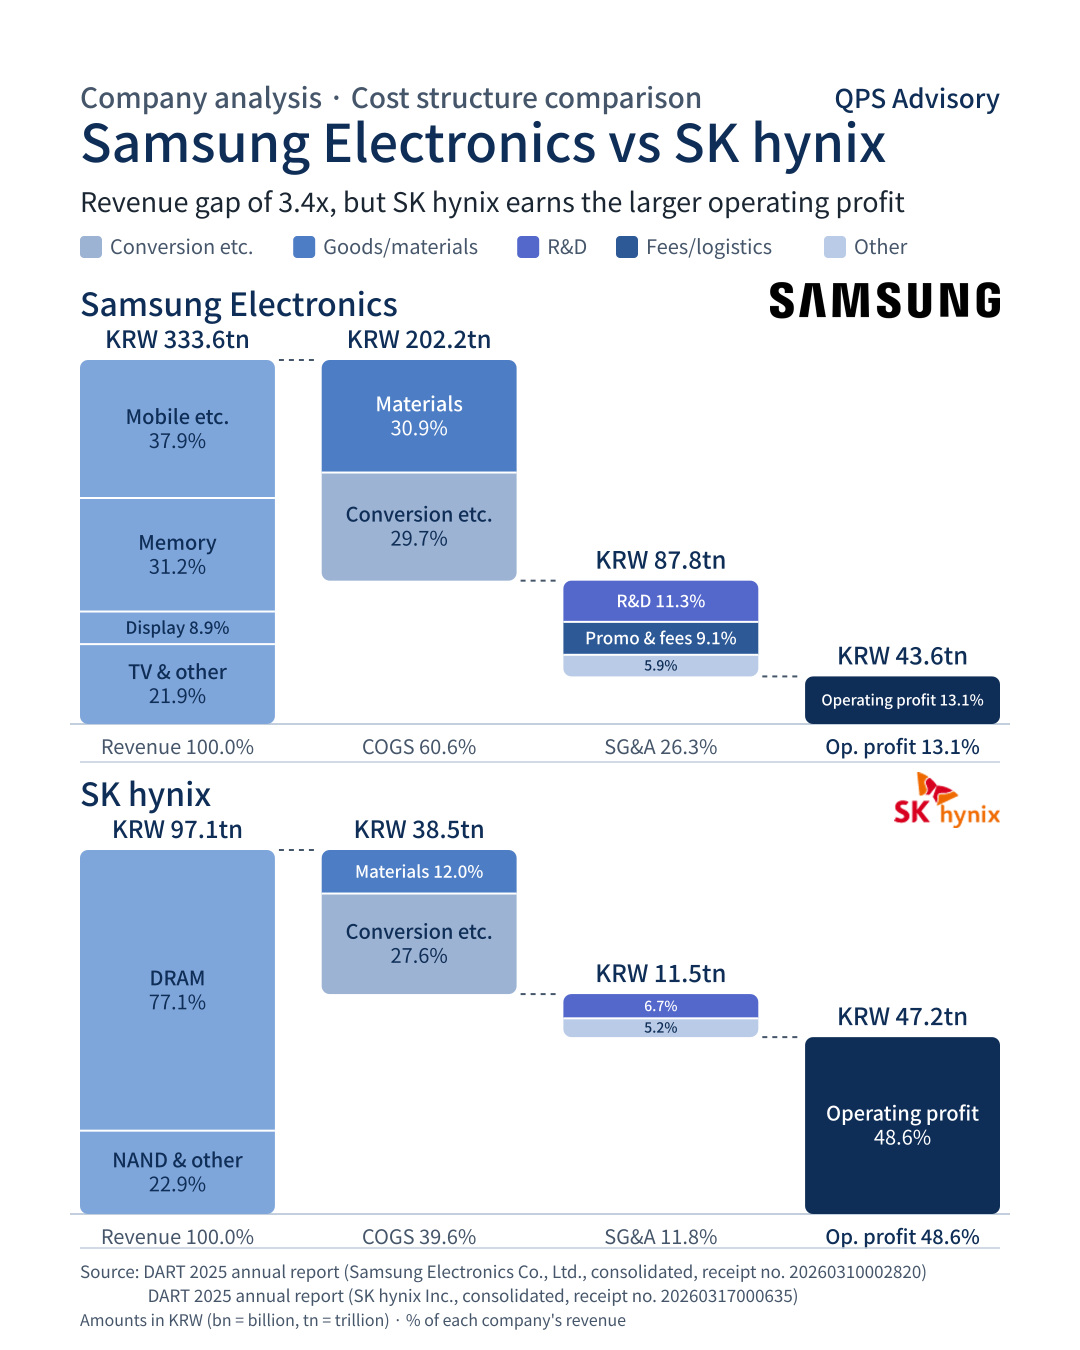
Samsung Electronics vs SK hynix: 3.4x Gap in Revenue, but SK hynix Has the Larger Operating Profit
We used the 2025 audit reports and annual reports to compare where each company's revenue went.
Based on the 2025 annual reports (consolidated), we put side by side where the revenue of the two companies goes.
Glossary: Cost of sales is the money spent buying or making the goods and products sold, and SG&A (selling, general and administrative expenses) is the money spent running the company, such as personnel costs, rent and advertising. Operating profit is the profit from the core business, i.e. revenue minus these two, and operating margin is operating profit divided by revenue. Separate financial statements cover only the company itself, while consolidated financial statements are figures that include subsidiaries.
USD figures are converted at KRW 1,450 = USD 1.
Samsung Electronics
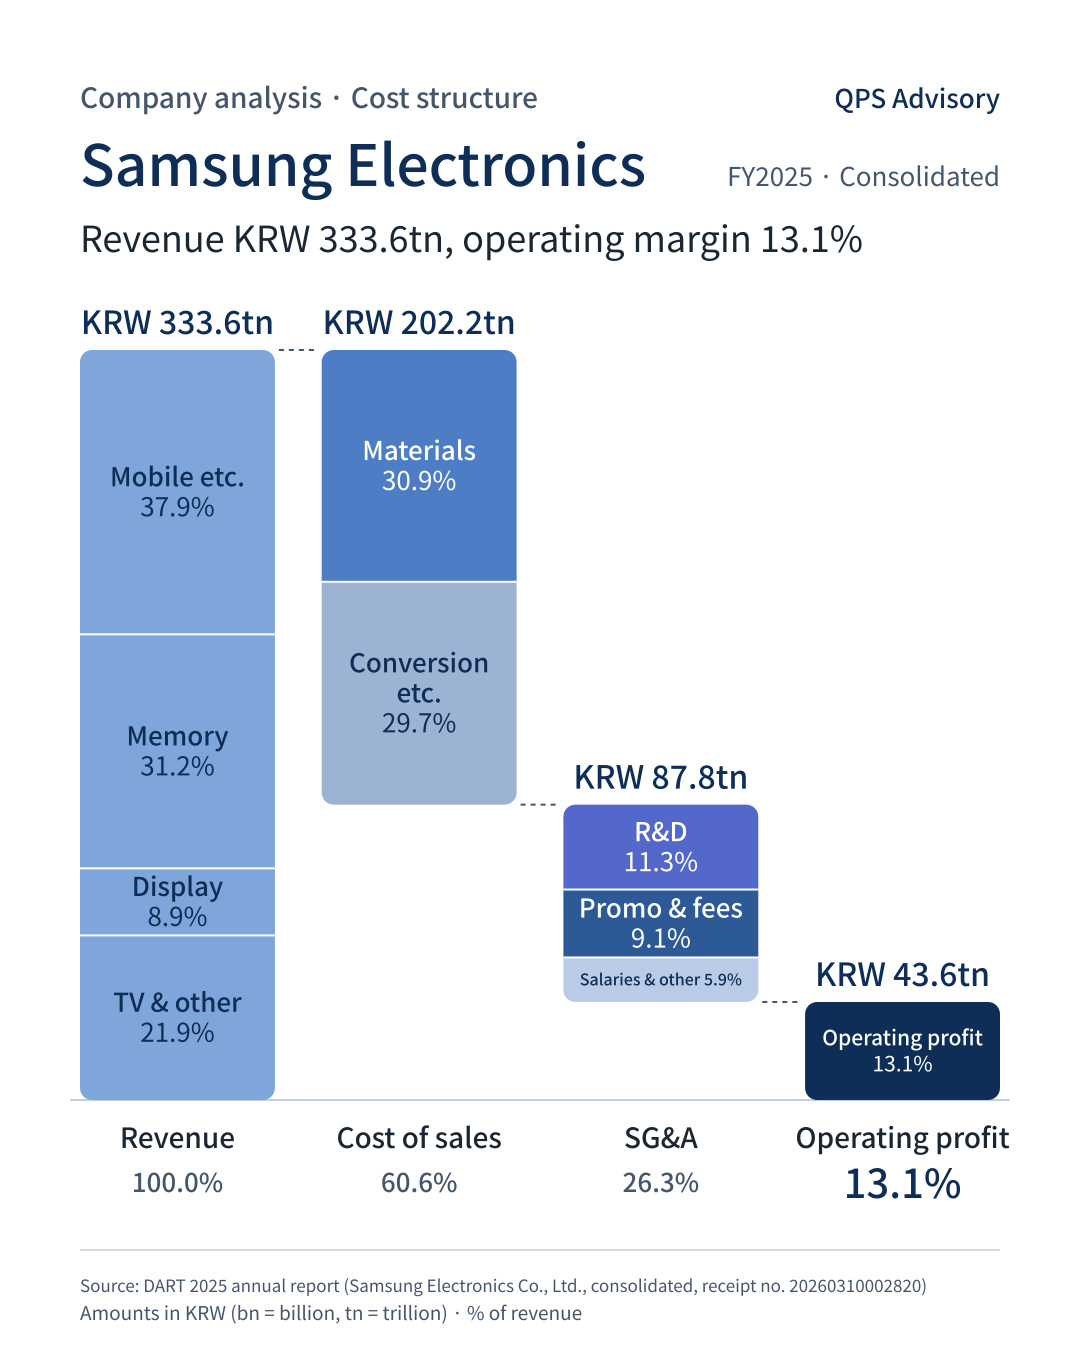
Revenue $230.1bn · Operating profit $30.1bn (13.1%)
- Revenue mix: Smartphones, etc. 37.9% / Memory 31.2% / Display 8.9% / TVs and other 21.9%
- Cost of sales $139.4bn (60.6%)
- Materials 30.9% / Conversion costs, etc. 29.7%
- SG&A $60.6bn (26.3%)
- R&D 11.3% / Sales promotion and commissions 9.1% / Salaries and other 5.9%
SK hynix
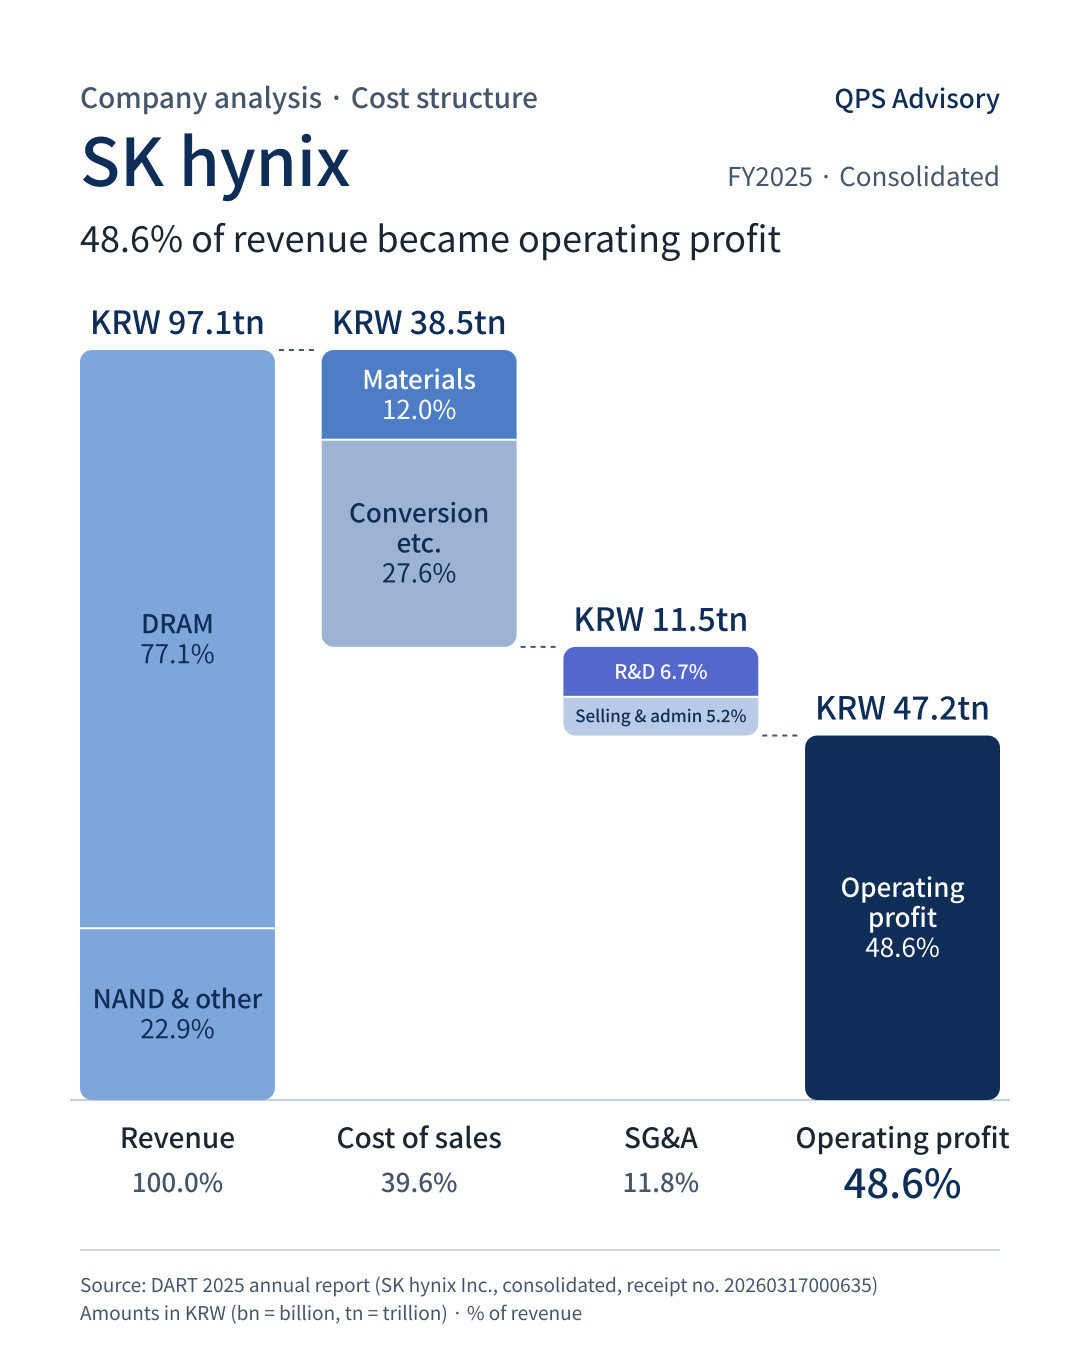
Revenue $67bn · Operating profit $32.6bn (48.6%)
- Revenue mix: DRAM 77.1% / NAND and other 22.9%
- Cost of sales $26.6bn (39.6%)
- Materials 12.0% / Conversion costs, etc. 27.6%
- SG&A $7.9bn (11.8%)
- R&D 6.7% / Selling and administrative 5.2%
Operating Expenses by Nature (Cost of Sales + SG&A, as % of Revenue)
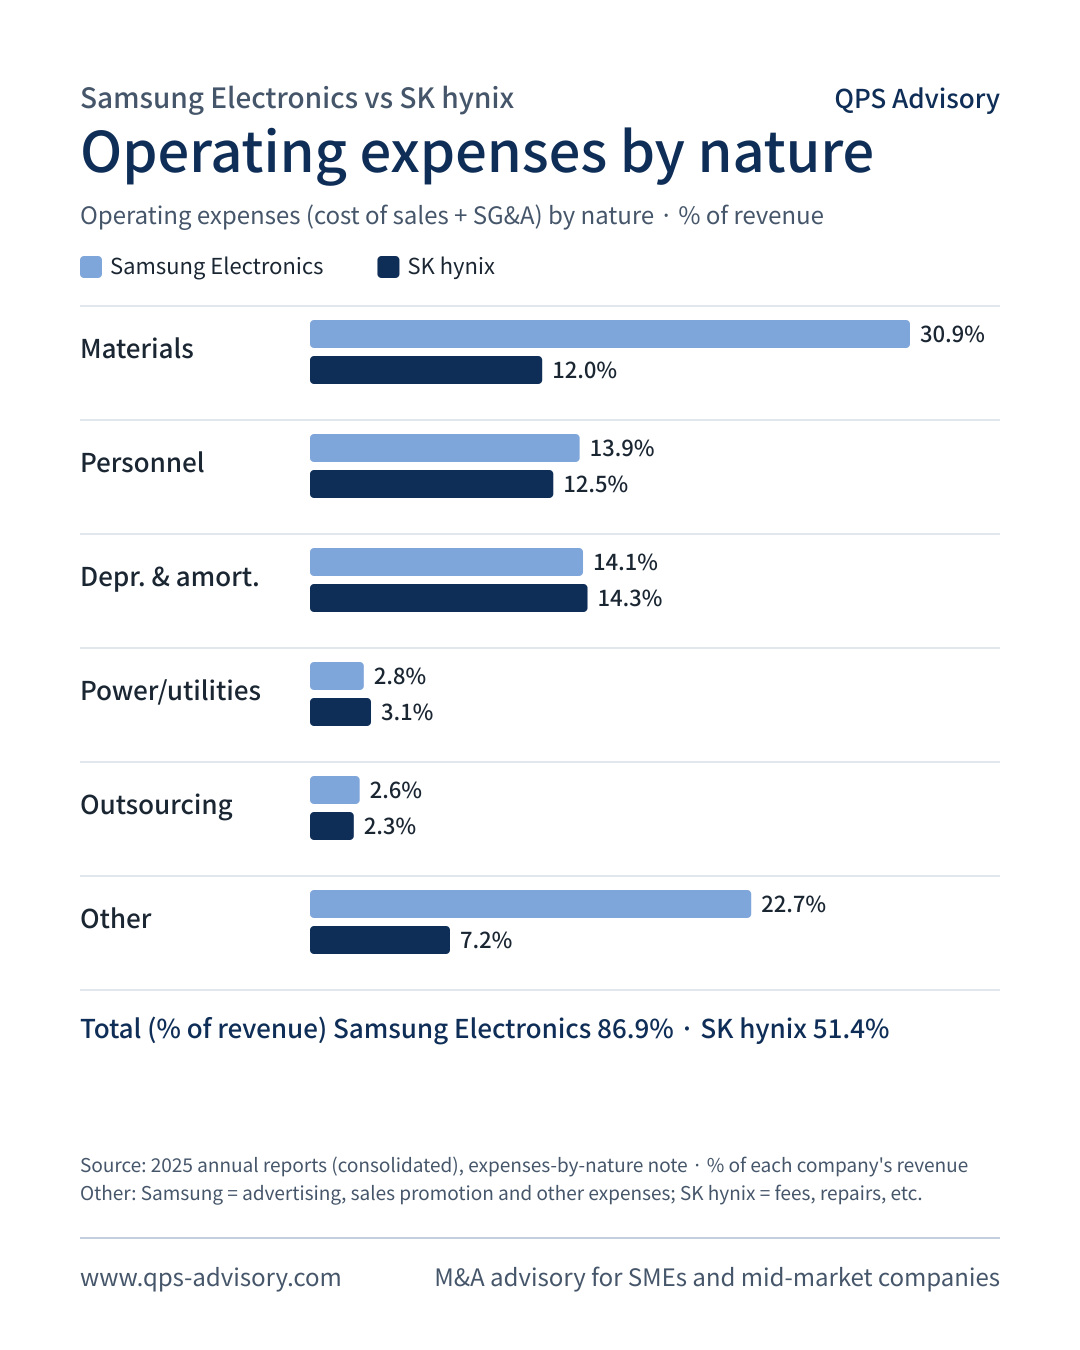
- Materials 30.9% vs 12.0%
- Personnel costs 13.9% vs 12.5%
- Depreciation and amortization 14.1% vs 14.3%
- Power and utilities 2.8% vs 3.1%
- Outsourced processing and services 2.6% vs 2.3%
- Other 22.7% vs 7.2%
- Total 86.9% vs 51.4%
Key Takeaways
- Samsung Electronics’ revenue is 3.4x that of SK hynix, but SK hynix’s operating profit ($32.6bn) is larger than Samsung Electronics’ ($30.1bn).
- Operating margin is 48.6% vs 13.1%. At SK hynix, nearly half of revenue remained as operating profit.
- Of the 21.0pp gap in cost of sales ratio (60.6% vs 39.6%), 18.9pp comes from materials (30.9% vs 12.0%).
- Memory revenue is of similar scale: $71.8bn at Samsung Electronics and $65.9bn in DRAM and NAND at SK hynix. At Samsung Electronics, finished-product revenue such as smartphones and TVs accounts for 47%.
- Conversion costs, etc., excluding materials, are similar at 29.7% for Samsung Electronics and 27.6% for SK hynix, and depreciation and amortization is also about 14% of revenue at both companies.
- R&D expenses within SG&A are $26bn (11.3%) at Samsung Electronics and $4.5bn (6.7%) at SK hynix.
Even among leading companies in the same semiconductor industry, where costs accumulate differs depending on the business mix. When looking at companies in M&A, too, this kind of cost structure is generally examined alongside margins.
Limitations of the Analysis
- Based on the consolidated financial statements in the 2025 annual reports.
- Materials were calculated by treating the full amount of raw materials and merchandise costs in the classification of expenses by nature as cost of sales.
- Because R&D expenses include personnel costs and depreciation and amortization, conversion costs were not broken down further.
- Because the two companies disclose expense-by-nature items under different categories, some were grouped into Other.
- This is a comparison of cost structures based on disclosed figures, and is not an investment recommendation or a business valuation.
Source: Financial Supervisory Service DART, 2025 annual reports (consolidated)
- Samsung Electronics Co., Ltd. (Receipt No. 20260310002820)
- SK hynix Inc. (Receipt No. 20260317000635) Ratios are relative to each company’s revenue.