Samsung Electronics vs SK hynix, Q2 2026: SK hynix's Net Income Exceeded Its Revenue
We traced how three-month (April–June) results in the 2026 half-year reports (consolidated) flowed from revenue to net income.
In Q2 2026 (April–June), SK hynix’s net income of $64.8bn was larger than its revenue of $54.7bn. Using three-month results in the 2026 half-year reports (consolidated), we traced how the revenue of Samsung Electronics and SK hynix flowed through to net income.
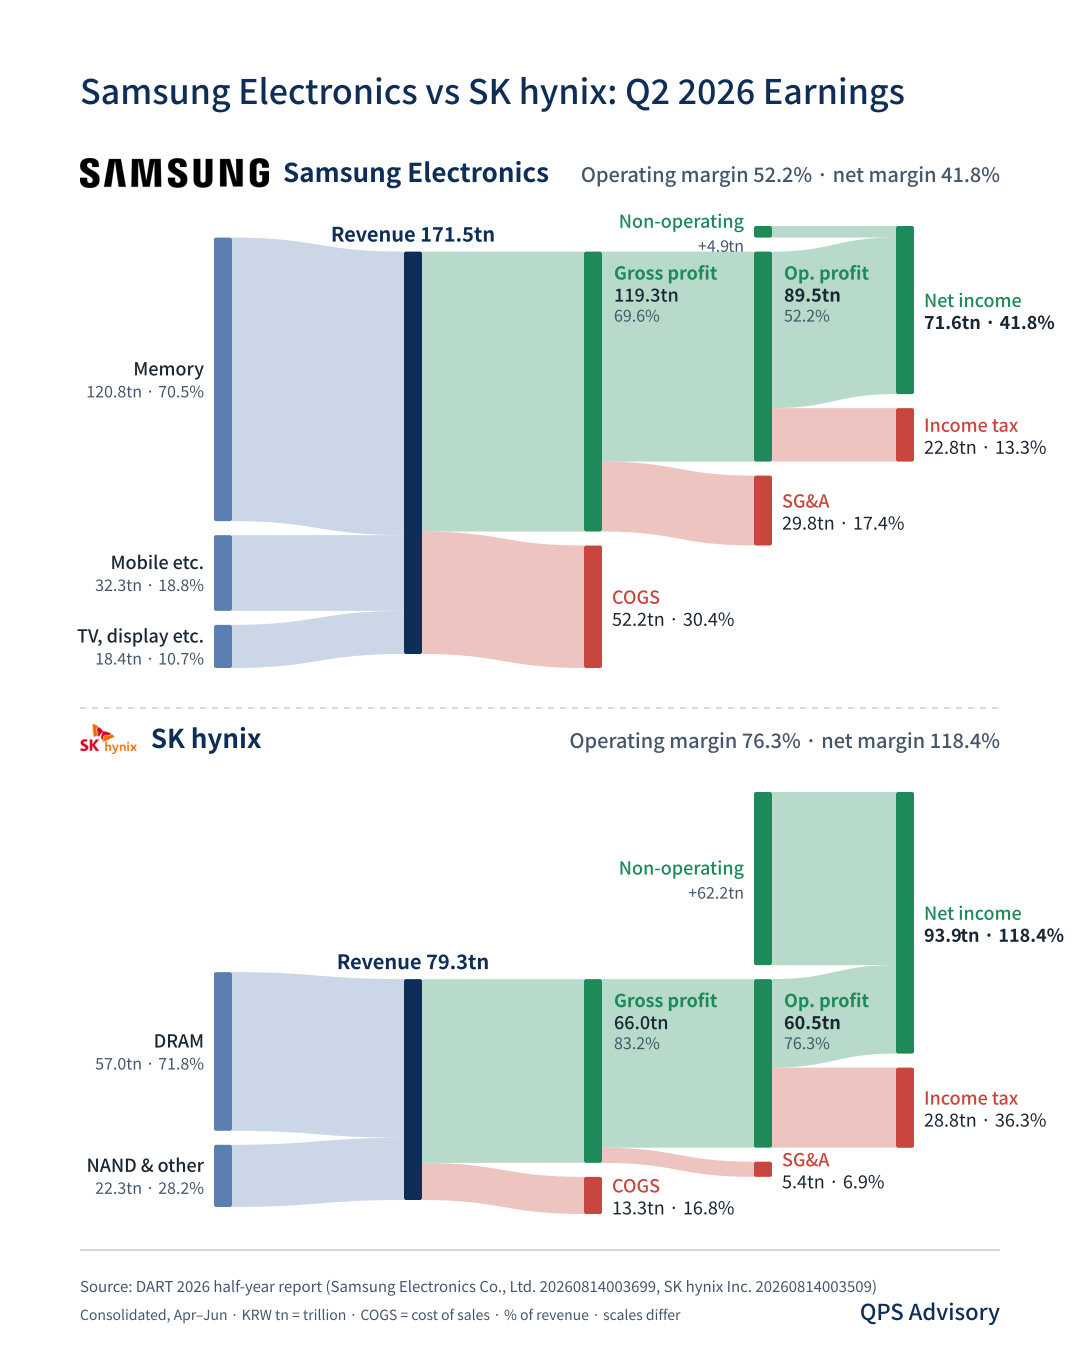
Glossary: Gross profit is revenue minus cost of sales (COGS, the cost of making the products sold). Operating profit is gross profit minus SG&A (R&D, selling and administrative expenses), i.e., the profit from the core business. Non-operating items are gains and losses outside the core business, such as valuation gains or losses on financial instruments and dividends. Net income is operating profit plus non-operating items, minus income tax. Consolidated financial statements include subsidiaries.
USD figures are converted at KRW 1,450 = USD 1.
Samsung Electronics
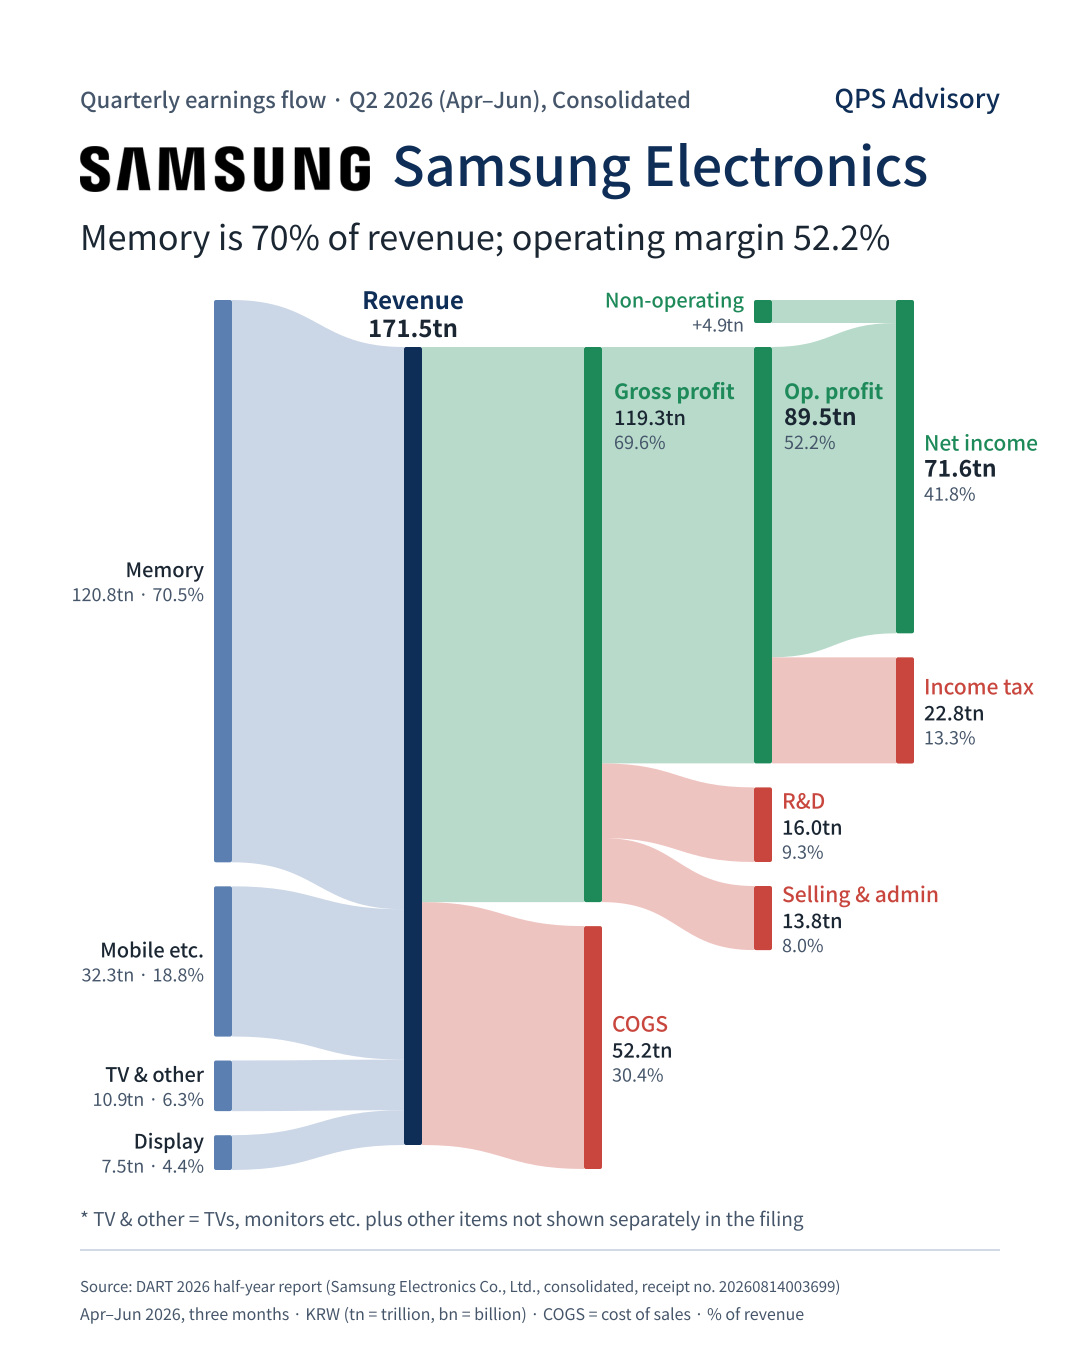
Revenue $118.3bn · Operating profit $61.7bn (52.2%) · Net income $49.4bn (41.8%)
- Revenue mix: Memory $83.3bn (70.5%) / Mobile etc. $22.3bn (18.8%) / TV and other $7.5bn (6.3%) / Display $5.2bn (4.4%)
- Cost of sales $36.0bn (30.4%) → Gross profit $82.3bn (69.6%)
- SG&A: R&D $11.1bn (9.3%) / Selling and administrative $9.5bn (8.0%)
- Non-operating items +$3.4bn, income tax $15.7bn (13.3%)
SK hynix
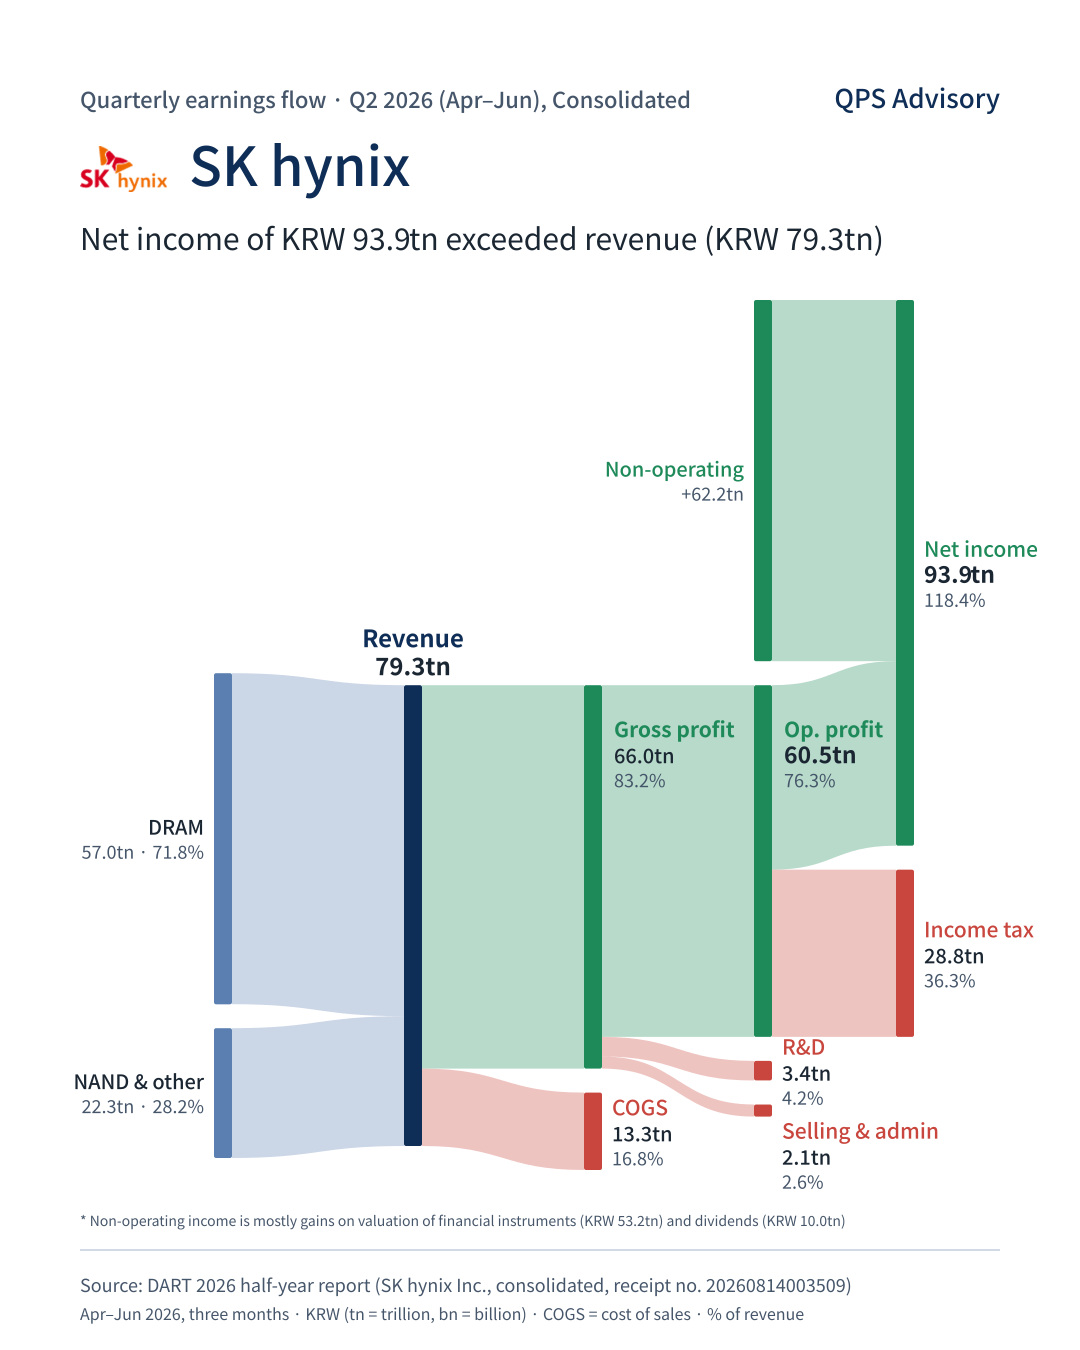
Revenue $54.7bn · Operating profit $41.8bn (76.3%) · Net income $64.8bn (118.4%)
- Revenue mix: DRAM $39.3bn (71.8%) / NAND and other $15.4bn (28.2%)
- Cost of sales $9.2bn (16.8%) → Gross profit $45.5bn (83.2%)
- SG&A: R&D $2.3bn (4.2%) / Selling and administrative $1.4bn (2.6%)
- Non-operating items +$42.9bn, income tax $19.9bn (36.3%)
Key Takeaways
- Revenue up 2.3x at Samsung and 3.6x at SK hynix in one year: versus April–June 2025, Samsung Electronics went from $51.4bn to $118.3bn and SK hynix from $15.3bn to $54.7bn.
- Operating margin of 76.3% at SK hynix and 52.2% at Samsung: operating profit was $61.7bn at Samsung Electronics and $41.8bn at SK hynix.
- Memory is 70% of revenue at both: Samsung Electronics’ memory revenue was $83.3bn (70.5%), and SK hynix’s DRAM revenue was $39.3bn (71.8%).
- Samsung’s profit came from semiconductors: segment operating profit was $61.5bn for DS (semiconductors) and -$564.7m for DX (mobile and TV).
- SK hynix’s net income exceeded its revenue: of its $64.8bn net income, non-operating items contributed +$42.9bn (gains on valuation of financial instruments $36.7bn, dividends $6.9bn).
Limitations of the Analysis
- Three-month (April–June) results on a consolidated basis from the DART 2026 half-year reports.
- Segment operating profit is as disclosed and includes inter-segment transactions.
- Samsung Electronics’ “TV and other” combines TVs, monitors etc. with other items not shown separately in the filing; SK hynix’s “NAND and other” combines NAND Flash and other.
- The two diagrams are drawn to different scales.
- This is a look at earnings structure based on disclosed figures, not an investment recommendation or a corporate valuation.
Source: Financial Supervisory Service DART
- Samsung Electronics Co., Ltd. 2026 Half-Year Report (Receipt No. 20260814003699)
- SK hynix Inc. 2026 Half-Year Report (Receipt No. 20260814003509) Ratios are relative to each company’s revenue.