Coupang vs Kurly: Similar Cost-of-Sales Ratios, an Operating Margin Gap Driven by SG&A
Using their 2025 audit report and annual business report, we compared where each company's revenue went.
Both are e-commerce companies selling fresh food and household goods online, but their 2025 filings show clearly where their profits diverge.
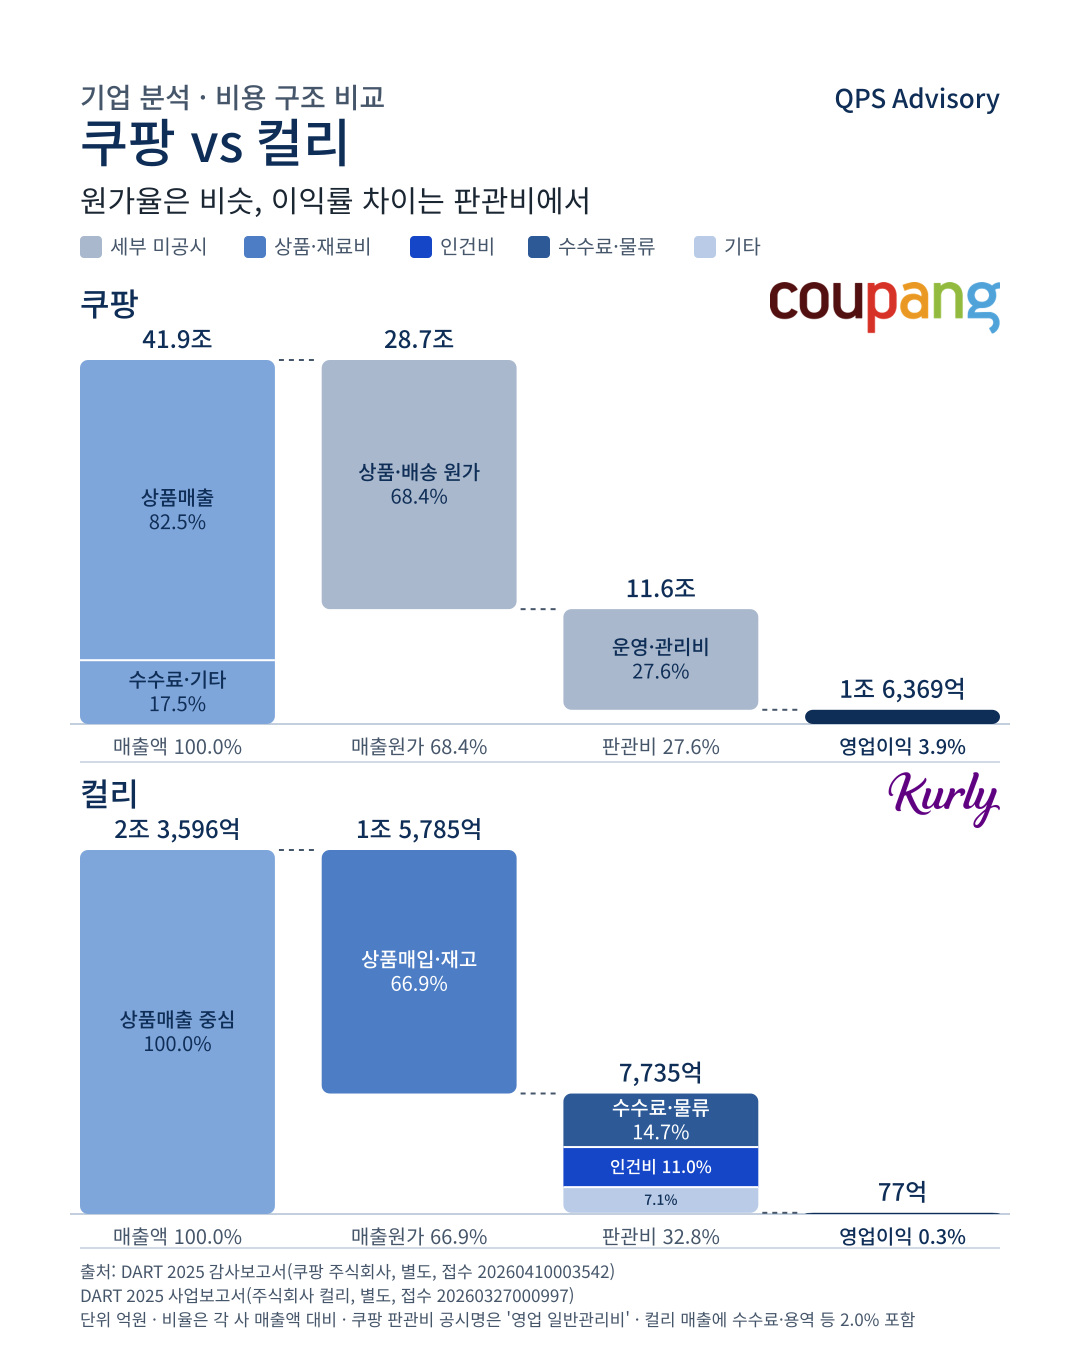
Glossary: Cost of sales is the money spent buying or making the goods and products sold. SG&A (selling, general and administrative expenses) is the money spent running the company, such as personnel costs, rent and advertising. Operating profit is the profit from the core business after subtracting both from revenue, and operating margin is operating profit divided by revenue. Separate financial statements cover only the single company, while consolidated financial statements include its subsidiaries.
USD figures are converted at KRW 1,450 = USD 1.
Coupang (Coupang Corp., separate)
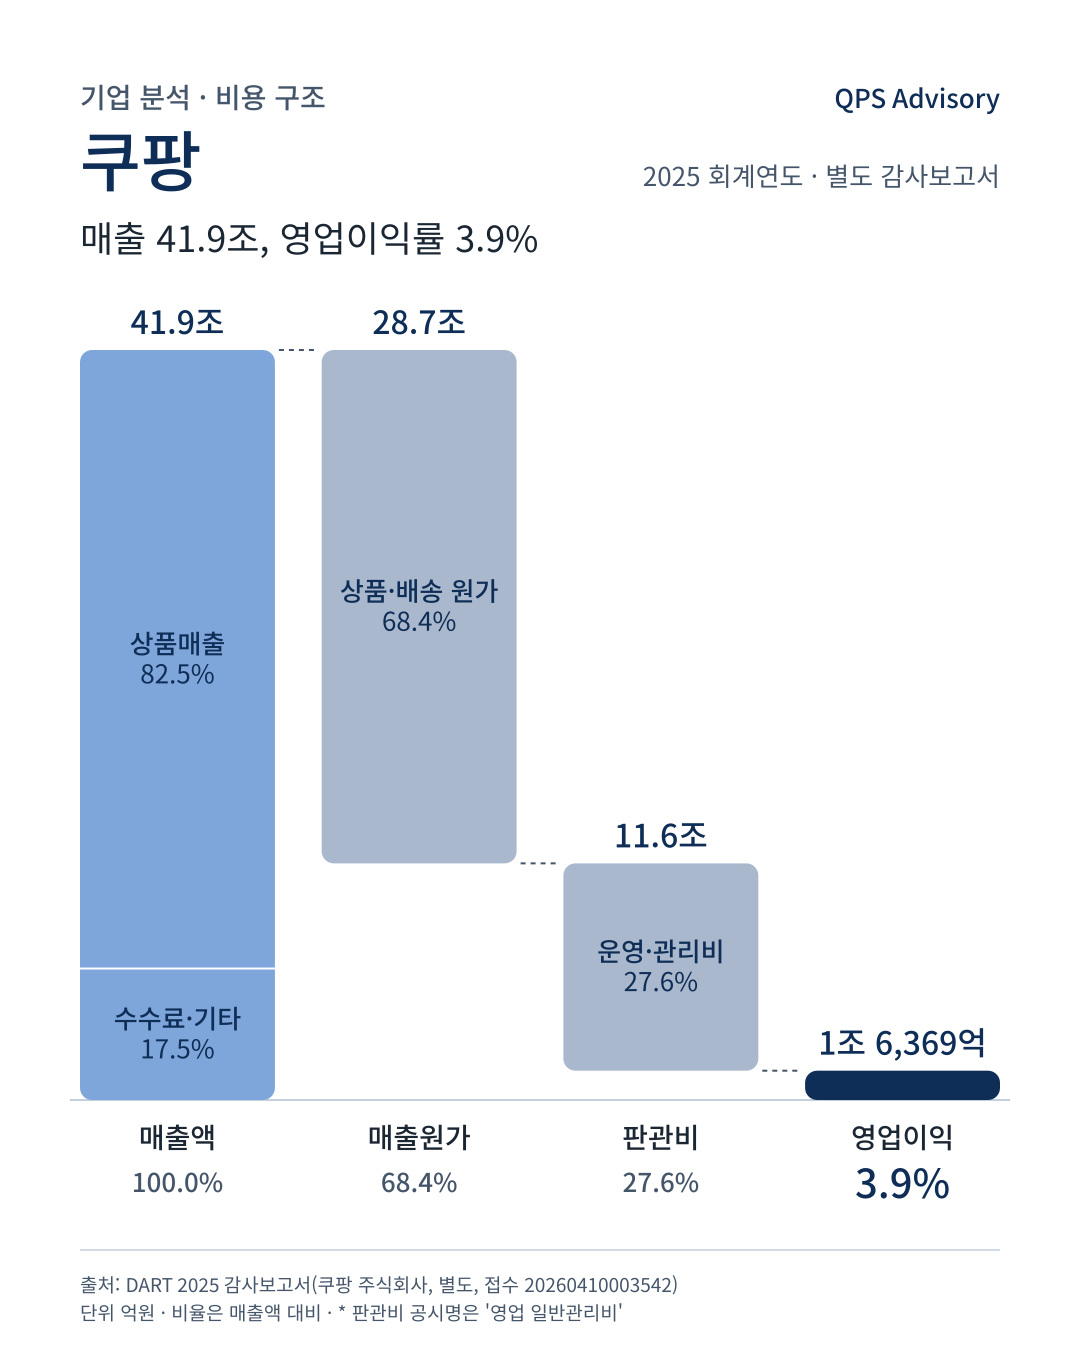
Revenue $28.9bn · Operating profit $1.1bn (3.9%)
- Revenue mix: Merchandise sales 82.5% / Commissions & other 17.5%
- Cost of sales $19.8bn (68.4%): Cost of merchandise and delivery-related costs (line-haul transportation, etc.)
- Operating, general and administrative expenses $8bn (27.6%): Fulfillment operations, customer service, payment processing fees, advertising, etc.
Kurly (Kurly Inc., separate)
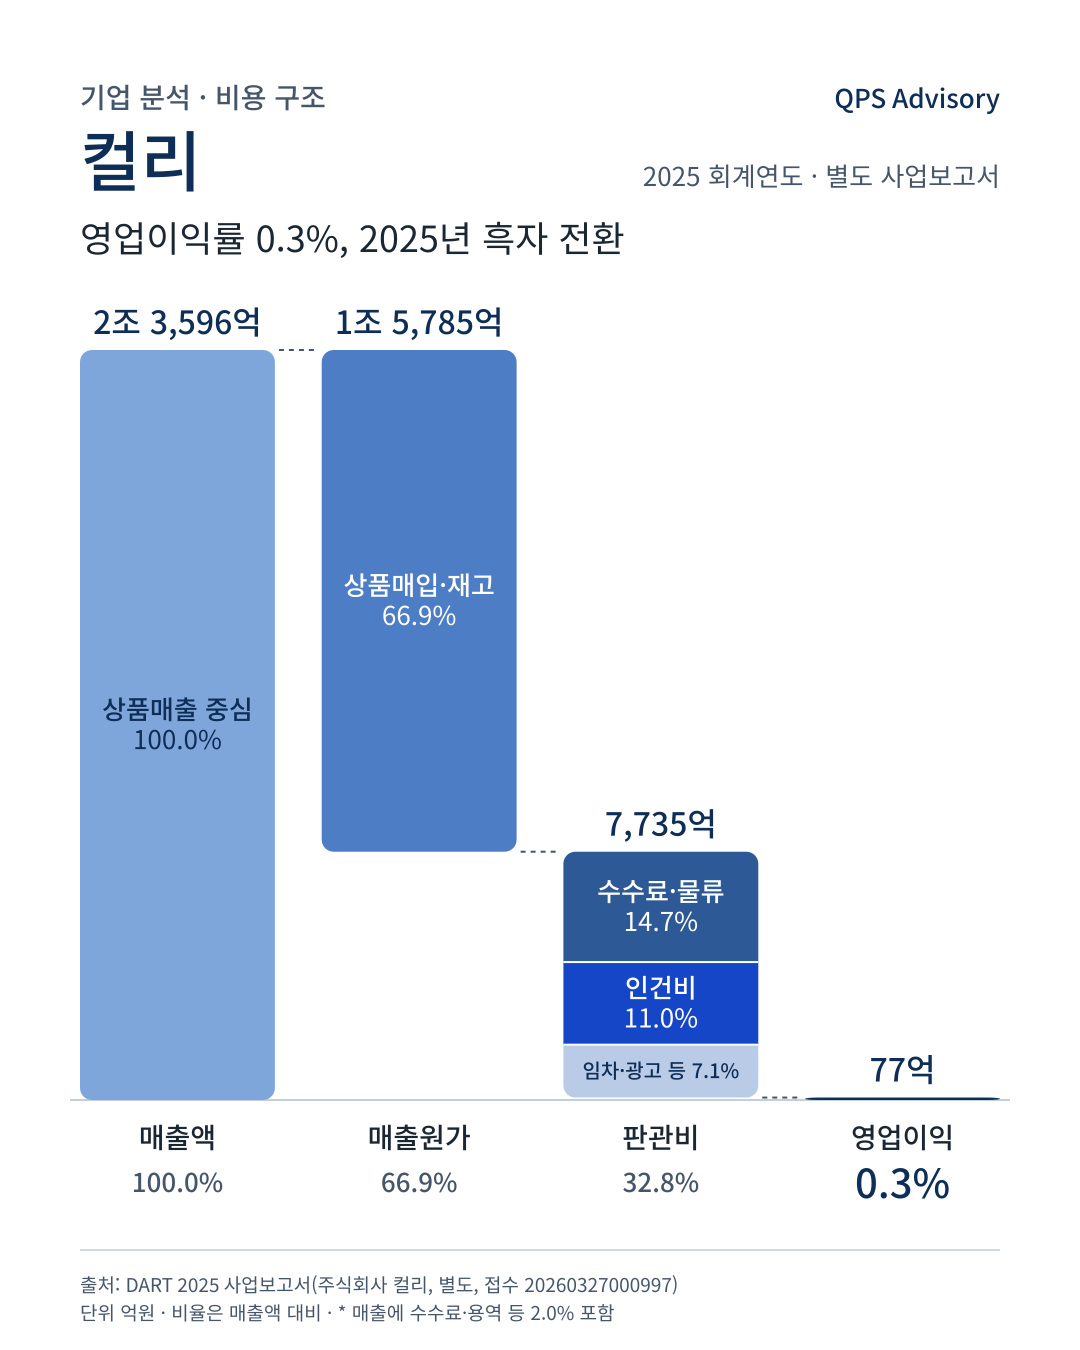
Revenue $1.6bn · Operating profit $5.3m (0.3%)
- Cost of sales $1.1bn (66.9%): 99.98% is merchandise purchasing and inventory costs
- SG&A $533.4m (32.8%)
- Fees & logistics 14.7% / Personnel costs 11.0% / Rent, advertising, etc. 7.1%
Key Takeaways
- Coupang’s revenue is 17.8 times Kurly’s. Operating margins are 3.9% versus 0.3%, and Kurly turned profitable, moving from an operating loss of $13.6m in 2024 to an operating profit of $5.3m in 2025.
- The cost-of-sales ratio is similar: 68.4% at Coupang and 66.9% at Kurly. Kurly’s gross margin is slightly higher.
- The SG&A ratio is 27.6% at Coupang and 32.8% at Kurly, about 5%p higher at Kurly. This gap carries through to the difference in operating margins.
- Costs build up in different places. At Coupang, personnel costs and freight and rent account for a large share; at Kurly, service fees account for a large share.
- Kurly paid $120.3m in fees (7.4% of revenue) to its delivery subsidiary Kurly Nextmile.
In M&A, when looking at a company, it is also common to examine not only margins but also where costs build up and which functions are outsourced to third parties or subsidiaries.
Limitations of the Analysis
- Both companies are based on 2025 separate financial statements (Coupang’s audit report, Kurly’s annual business report) and do not include subsidiaries’ results.
- Coupang’s cost of sales (cost of merchandise + delivery-related costs) and operating, general and administrative expenses (fulfillment operations, customer service, etc.) were not broken down, as itemized amounts are not disclosed.
- The ratios for personnel costs, freight and rent are based on the notes classifying expenses by nature, and Coupang discloses only some of these items.
- Some items have been grouped together for readability.
- This is a comparison of cost structures based on disclosed figures and is not an investment recommendation or a business valuation.
Source: Financial Supervisory Service DART
- Coupang Corp. 2025 Audit Report (Receipt No. 20260410003542)
- Kurly Inc. 2025 Annual Business Report (Receipt No. 20260327000997) Ratios are as a percentage of each company’s revenue.