Asung Daiso vs Starbucks Korea: Daiso Spends on Merchandise, Starbucks Spends on People and Stores
We compared where each company's revenue went, based on their 2025 audit reports and business reports.
Both are store-based retailers, but their 2025 audit reports show that where their costs go differs greatly.
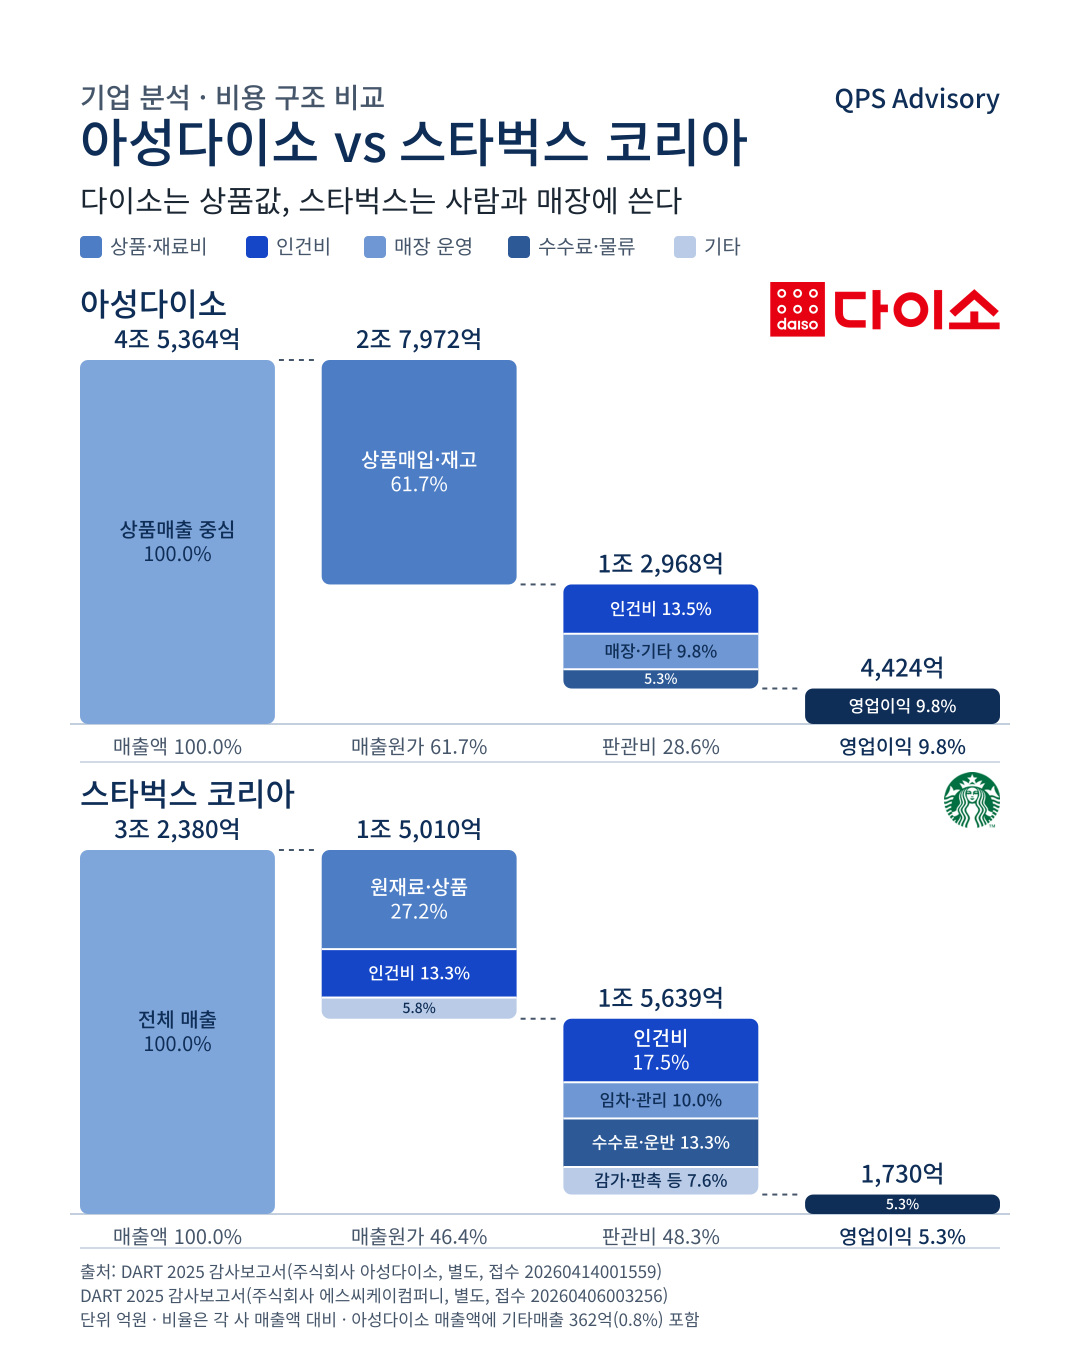
Glossary: Cost of sales is the money spent to purchase or produce the goods and products sold, and SG&A (selling, general and administrative expenses) is the money spent to run the company, such as personnel costs, rent and advertising. Operating profit is the profit from the core business after subtracting both from revenue, and operating margin is operating profit divided by revenue. Separate financial statements cover a single company only, while consolidated financial statements include subsidiaries.
USD figures are converted at KRW 1,450 = USD 1.
Asung Daiso: A Cost-of-Goods-Driven Structure
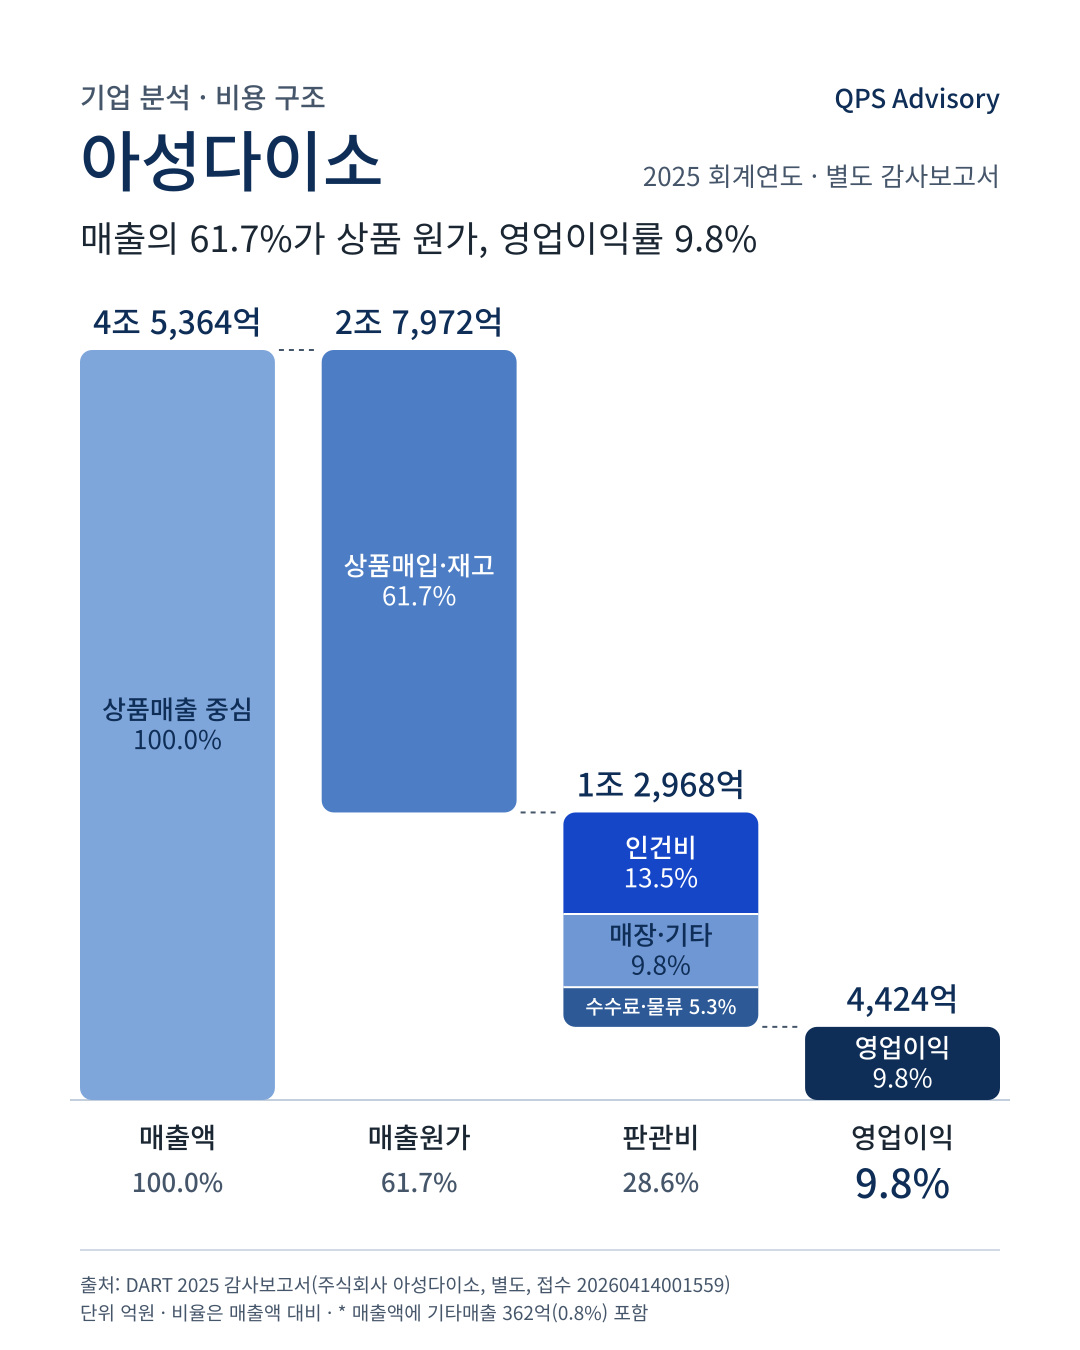
Revenue $3.1bn · Operating profit $305.1m (9.8%)
- Cost of sales $1.9bn (61.7%): mostly merchandise purchase costs
- SG&A $894.3m (28.6%)
- Personnel 13.5% / Stores & other 9.8% / Fees & logistics 5.3%
Starbucks Korea: An Operating-Expense-Driven Structure
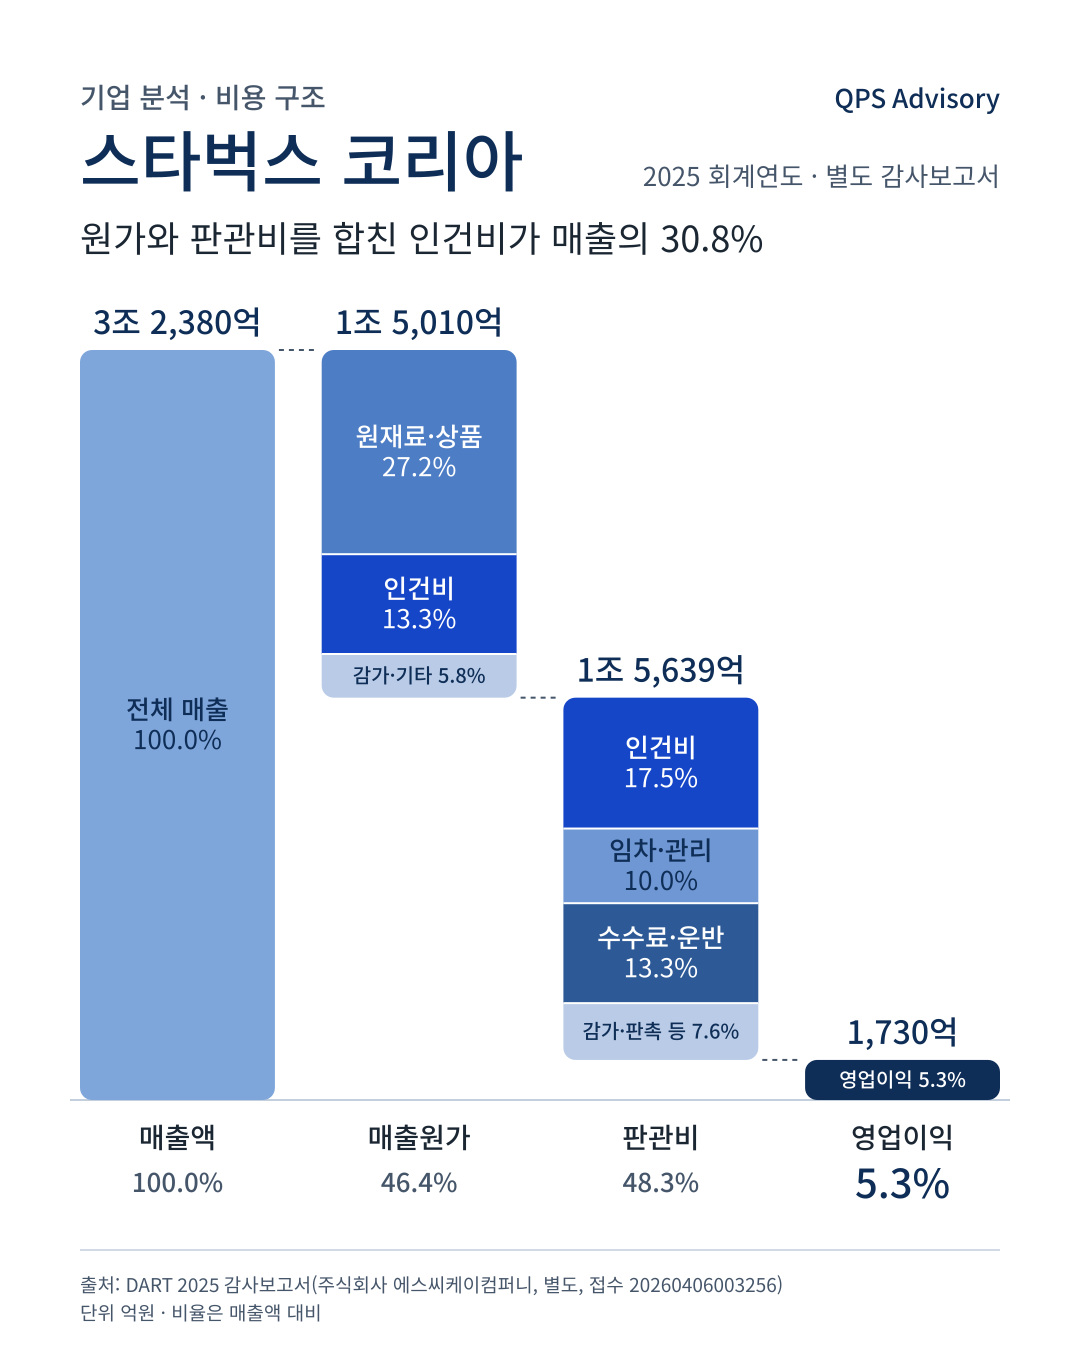
Revenue $2.2bn · Operating profit $119.3m (5.3%)
- Cost of sales $1bn (46.4%)
- Raw materials & merchandise 27.2% / Personnel 13.3% / Depreciation & other 5.8%
- SG&A $1.1bn (48.3%)
- Personnel 17.5% / Fees & transportation 13.3% / Rent & maintenance 10.0% / Depreciation, promotion, etc. 7.6%
Key Takeaways
- The cost-of-sales ratio is 61.7% for Daiso and 46.4% for Starbucks. Daiso’s cost of sales consists entirely of merchandise purchases with no manufacturing costs, while Starbucks’ includes the costs of making beverages and food, such as raw and subsidiary materials and personnel costs.
- Rent as a share of revenue is 5.1% for Daiso and 9.9% for Starbucks, higher at Starbucks. Starbucks additionally has depreciation of right-of-use assets of 3.6%.
- Fees and logistics costs are 5.3% for Daiso, versus 13.3% for Starbucks’ fees and transportation costs, lower at Daiso.
- Personnel costs within SG&A are 13.5% for Daiso and 17.5% for Starbucks. Including personnel costs within cost of sales, Starbucks’ figure is 30.8%.
- As a result, operating margin is 9.8% for Daiso and 5.3% for Starbucks. Daiso has a higher cost-of-sales ratio, but a lower burden of rent, fees and personnel costs.
When looking at a company in M&A, it is also common to examine this kind of cost structure alongside profit margins.
Limitations of the Analysis
- Based on the separate financial statements in the 2025 audit reports; if there are subsidiaries, their results are not included.
- Daiso applies Korean Generally Accepted Accounting Principles (K-GAAP) and Starbucks applies K-IFRS, so the presentation of lease expenses differs.
- Personnel costs and other items within Starbucks’ cost of sales are back-calculated by subtracting SG&A items from the classification of expenses by nature.
- Some items have been grouped together for readability.
- This is a comparison of cost structures based on disclosed figures, and is not an investment recommendation or a business valuation.
Source: Financial Supervisory Service DART, 2025 audit reports (separate)
- Asung Daiso Co., Ltd. (Receipt No. 20260414001559)
- SCK Company Co., Ltd. (Starbucks Korea) (Receipt No. 20260406003256) Ratios are relative to each company’s revenue.