Mega MGC Coffee vs Compose Coffee: 2.2x Apart in Revenue, 2.8x Apart in Operating Profit
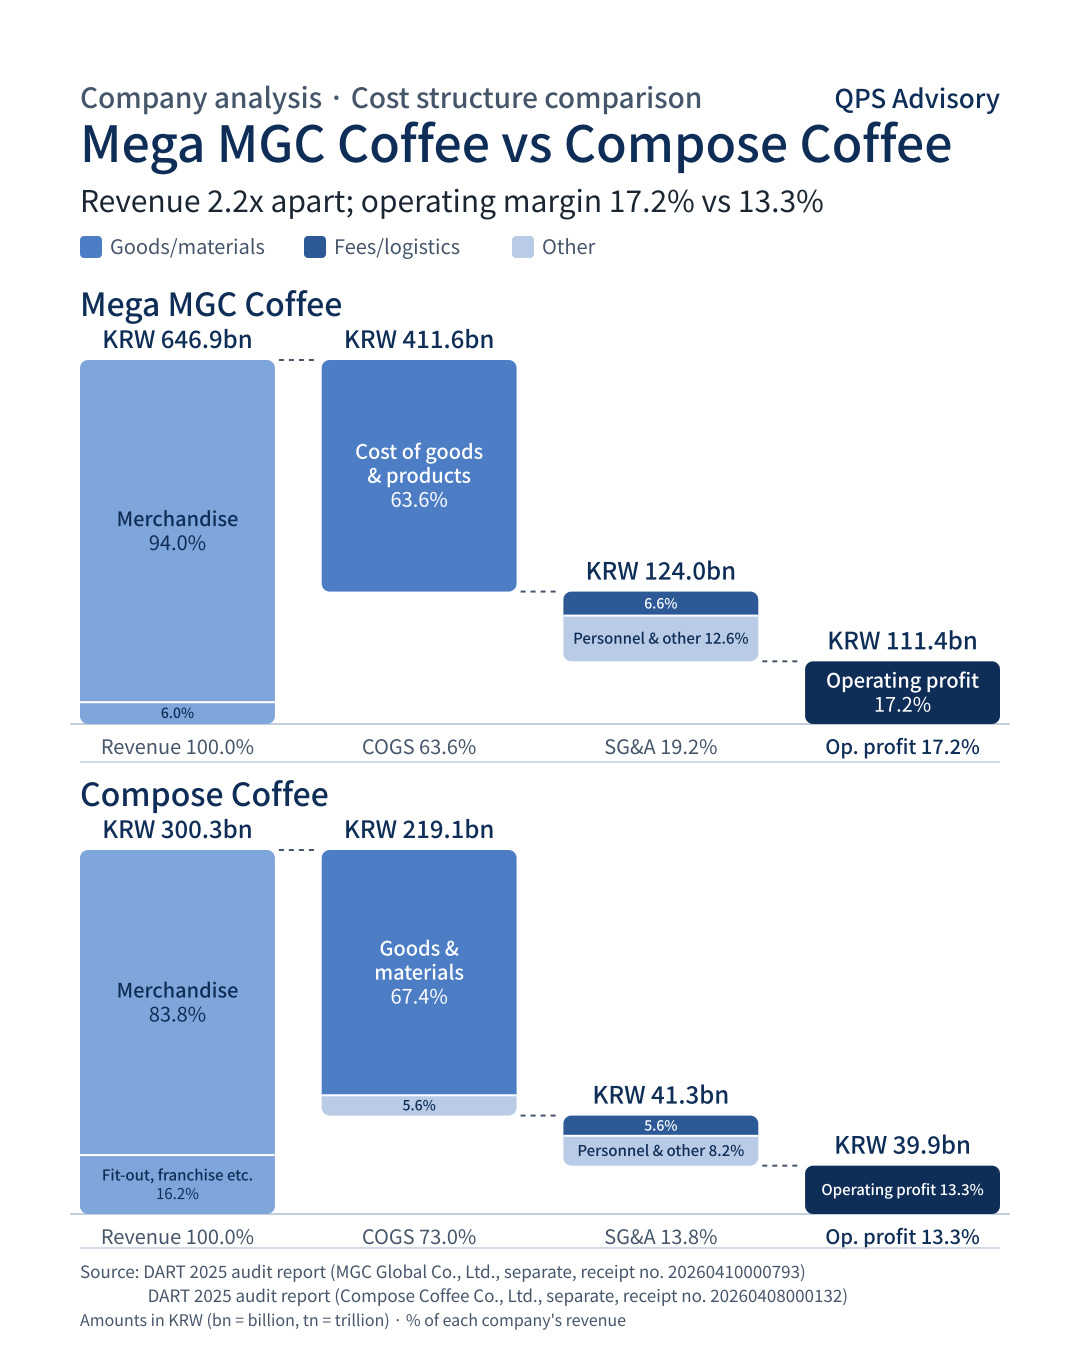
Using 2025 audit reports, we compared where each company's revenue went.
Mega MGC Coffee and Compose Coffee are both headquarters of low-price coffee franchises, yet they spend their revenue in different places. We compared their cost structures using their 2025 audit reports.
Glossary: Cost of sales is the money spent buying or making the goods and products sold. SG&A (selling, general and administrative expenses) is the money spent running the company, such as personnel costs, rent and advertising. Operating profit is the profit from the core business, i.e., revenue minus these two items, and operating margin is operating profit divided by revenue. Separate financial statements cover only the company itself, while consolidated financial statements include subsidiaries.
USD figures are converted at KRW 1,450 = USD 1.
Mega MGC Coffee (MGC Global, separate)
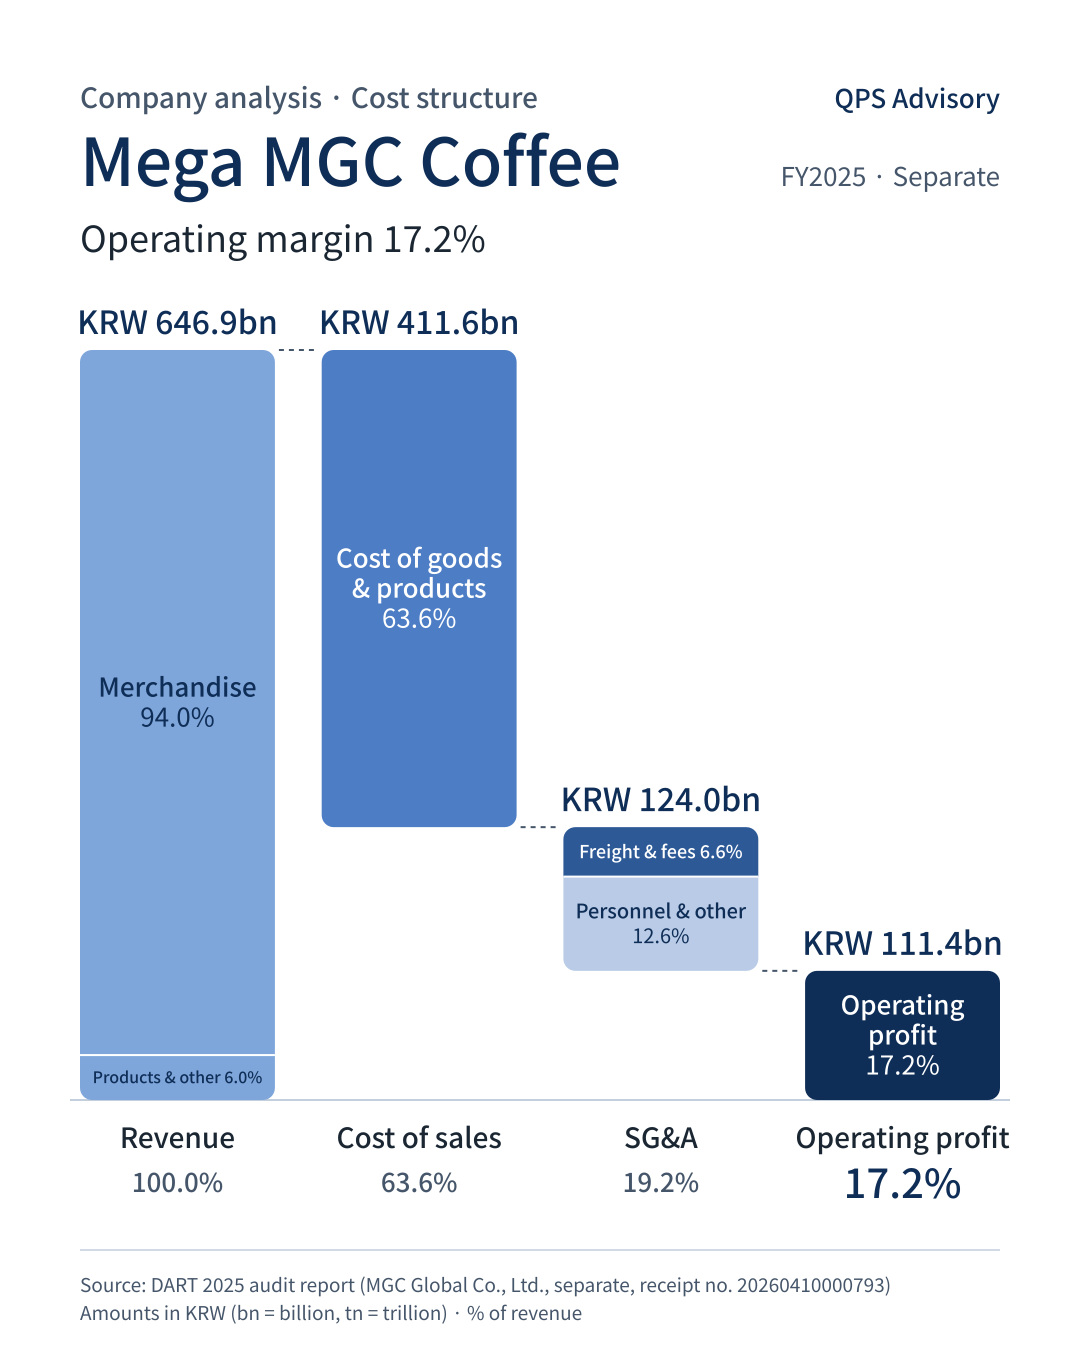
Revenue $446.2m · Operating profit $76.8m (17.2%)
- Revenue mix: Merchandise 94.0% / Products and other 6.0%
- Cost of sales $283.9m (63.6%): cost of merchandise sold $278.4m + cost of products sold $5.5m
- SG&A $85.5m (19.2%)
- Freight and fees 6.6% / Advertising 5.0% / Personnel 4.1% / Other 3.4%
Compose Coffee (Compose Coffee, separate)
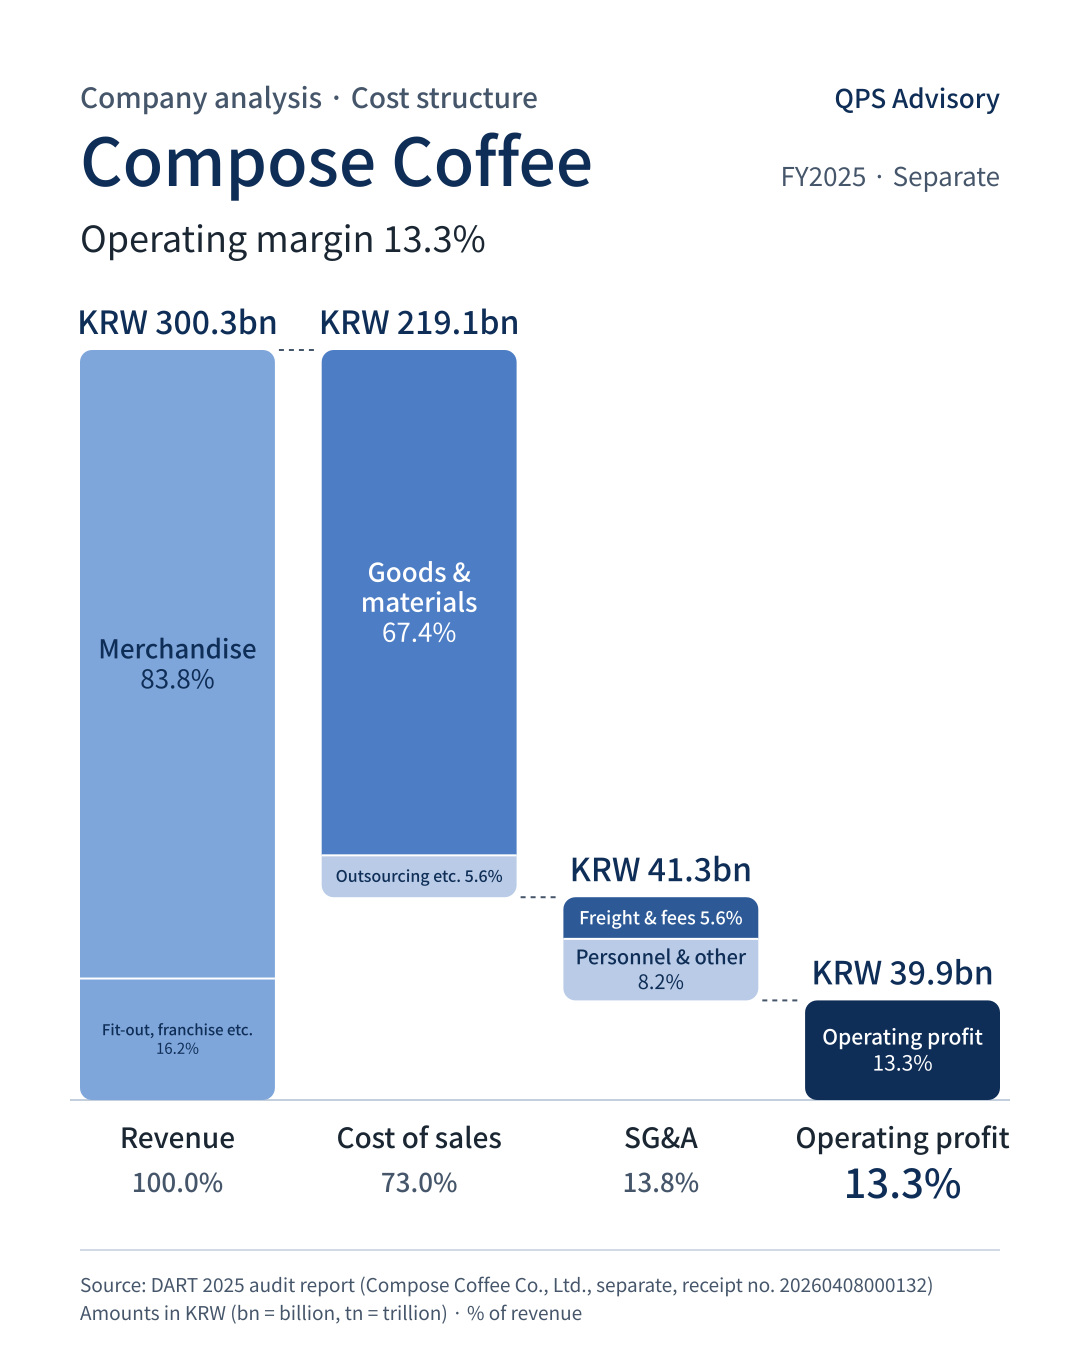
Revenue $207.1m · Operating profit $27.5m (13.3%)
- Revenue mix: Merchandise 83.8% / Store fit-out, franchise fees and other 16.2%
- Cost of sales $151.1m (73.0%): goods and raw materials 67.4%, outsourced fit-out work and other 5.6%
- SG&A $28.5m (13.8%)
- Freight and fees 5.6% / Advertising 3.4% / Personnel 3.2% / Other 1.7%
Key Takeaways
- 2.2x the revenue, 2.8x the operating profit: Mega posted revenue of $446.2m and operating profit of $76.8m (17.2%); Compose posted $207.1m and $27.5m (13.3%).
- The revenue mix differs. Merchandise sales are 94.0% of Mega’s revenue, while Compose has 83.8% merchandise plus 16.2% from store fit-out, franchise fees and other.
- Compose’s cost-of-sales ratio is 9.3%p higher: 73.0% vs 63.6%. Besides goods and raw materials (67.4%), Compose’s cost of sales includes outsourced fit-out work and other items (5.6%).
- Mega’s SG&A ratio is 5.4%p higher: 19.2% vs 13.8%. Freight and fees are similar at 6.6% vs 5.6%; the gap comes from personnel and other costs (12.6% vs 8.2%).
Limitations of the Analysis
- Based on separate financial statements in the 2025 audit reports; results of subsidiaries are not included.
- MGC Global, the operator of Mega MGC Coffee, reports under Korean GAAP (K-GAAP), while Compose Coffee reports under K-IFRS (first adopted in 2025), so account presentation may differ.
- Mega’s cost of sales is shown as a single block because a breakdown by nature is not disclosed. Compose’s outsourced fit-out work and other items were calculated by subtracting SG&A from the classification of expenses by nature.
- Compose’s 2024 financial statements were not audited and had a different revenue mix (no merchandise sales in 2024), so no year-on-year comparison is made.
- Some items have been grouped together for readability.
- This is a comparison of cost structures based on disclosed figures, not an investment recommendation or a corporate valuation.
Source: Financial Supervisory Service DART
- MGC Global Co., Ltd. (operator of Mega MGC Coffee) 2025 Audit Report (Receipt No. 20260410000793)
- Compose Coffee Co., Ltd. 2025 Audit Report (Receipt No. 20260408000132) Ratios are relative to each company’s revenue.